182 Business Analytics & Intelligence courses
This one day course has been developed to teach essential real estate financial modelling theory, functions and formulas to individuals working in the real estate sector.
Dashboard In A Day (DIAD)
By Online Productivity Training
OVERVIEW DIAD is a one-day, hands-on workshop for business analysts, covering the breadth of Power BI capabilities. The course focuses on five practical Labs and at the end of the day, attendees will better understand how to: * Connect and transform data from a variety of data sources. * Define business rules and KPIs. * Explore data with powerful interactive visuals. * Build stunning reports. * Share their dashboards with their team business partners and publish them to the web. The course content is managed by the Power BI engineering team at Microsoft. There is no exam associated with the course. COURSE BENEFITS: * Learn how to clean, transform, and load data from various sources * Create and manage a data model in Power BI consisting of multiple tables connected with relationships * Build Measures and other calculations in the DAX language to plot in reports * Manage and share report assets to the Power BI Service WHO IS THE COURSE FOR? * Data Analysts and Management Consultants with little or no experience of Power BI who wish to upgrade their knowledge to include Business Intelligence * Analysts looking for a quick introduction to Power BI who don’t have the time for the full three day PL-300 course * Marketers in data-intensive organisations who need new tools to build visually appealing, dynamic charts for their stakeholders to use LAB OUTLINE Lab 1 Accessing & Preparing The Data * Load data from Excel and CSV sources * Manipulate the data to prepare it for reporting * Prepare tables in Power Query and load them into the data model Lab 2 Data Modelling And Exploration * Create a range of different charts * Highlight and cross-filter * Create new groups and hierarchies * Add new measures to the model Lab 3 Data Visualization * Add conditional formatting to a report * Add logos to a filter * Import a custom visual * Apply a custom theme * Add bookmarks to the report to tell a story Lab 4 Publishing A Report And Creating A Dashboard * Create a Workspace in the Power BI Service * Publish a report to the Service * Create a Dashboard and pin visuals to it * Generate and view insights Lab 5 Collaboration * Share a Dashboard * Access a Dashboard on a Mobile Device

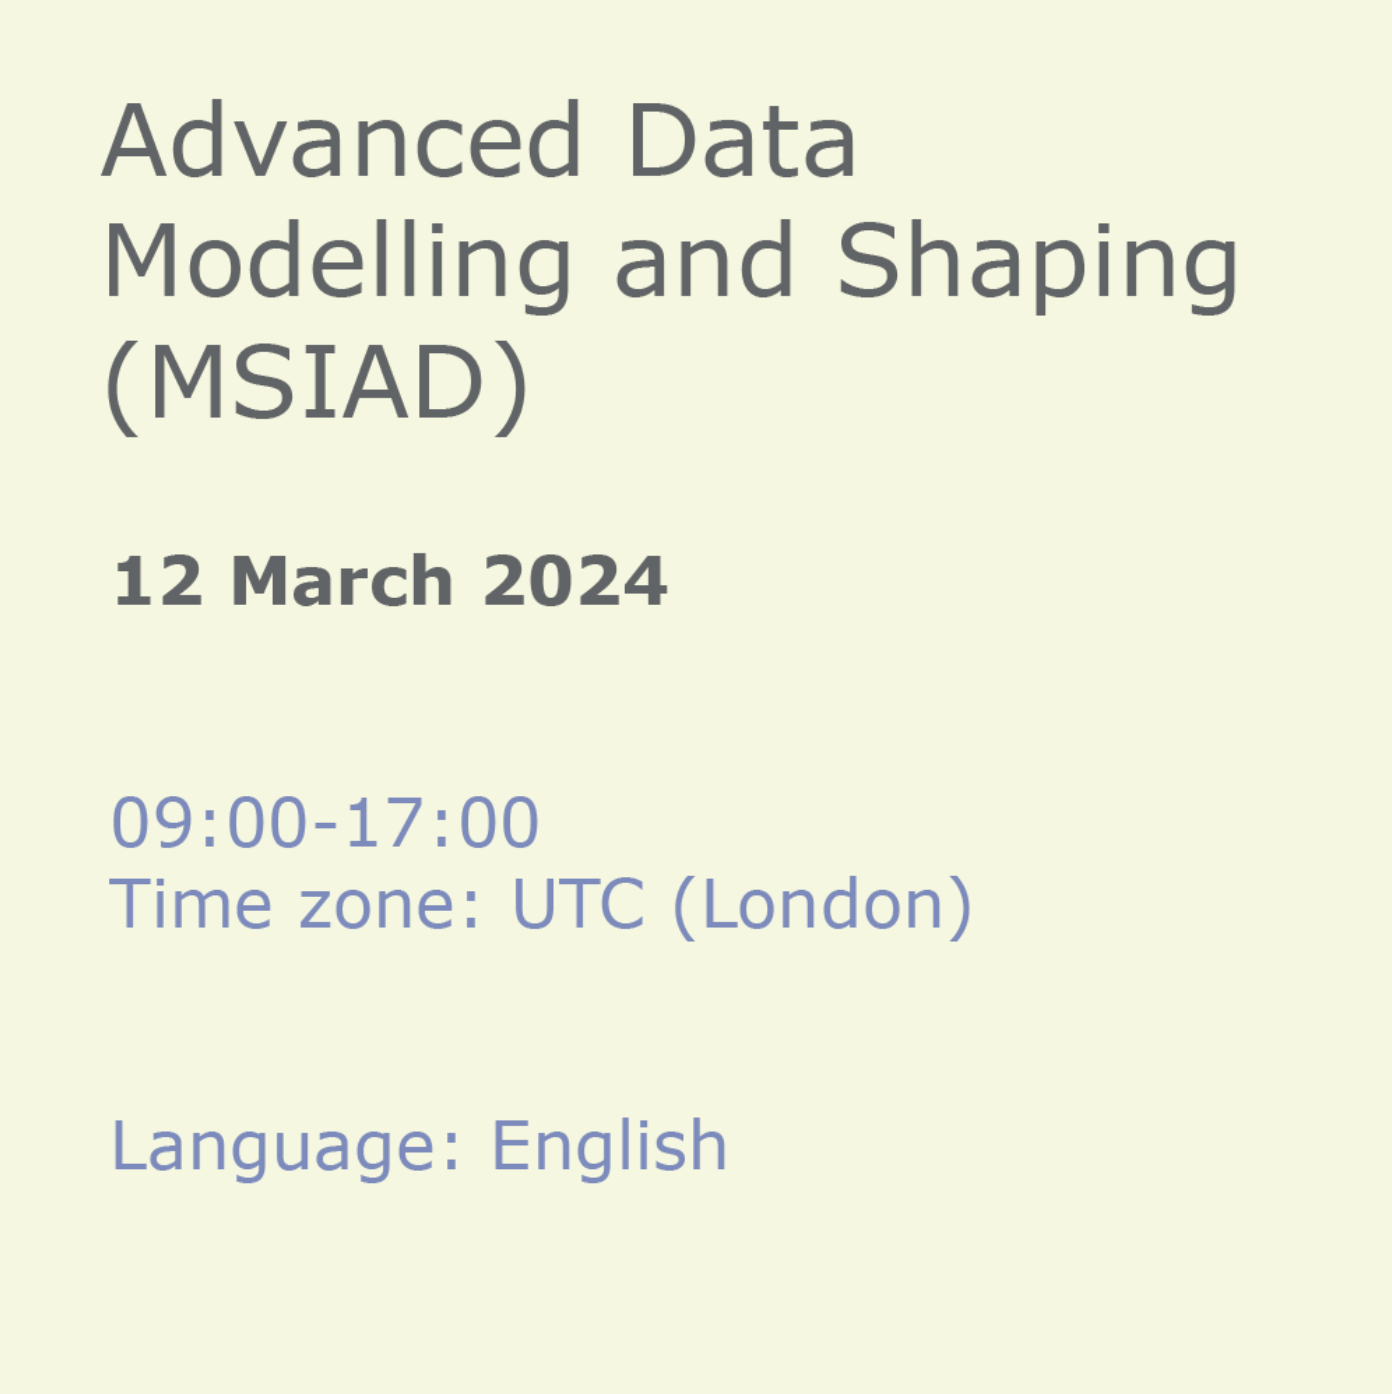
Advanced Data Modelling and Shaping (MSIAD)
By Online Productivity Training
OVERVIEW Prerequisites—DIAD training or equivalent working experience This one-day course will cover using Power BI Desktop to import and shape data from a variety of sources. It will also walk through Power BI capabilities you can use to enhance the data model for your business users. The course covers key aspects of how to create a great data model to meet your business needs, various features in Power BI used to enhance data models so you can build great reports, and an introduction to DAX to create calculations. After completing this training, the attendees should be able to import data from a variety of data sources into Power BI, shape the data, create the data model, and write DAX functions to the Power BI model. COURSE BENEFITS: * Understand the Power BI Desktop data model, its components and most effective schemas * Describe concepts of calculated columns and measures * Create queries using M * Create calculations with DAX * Understand the use of functions * Create and optimize a data model * Understand the consequences of data model design decisions WHO IS THE COURSE FOR? * Power BI report developers who wish to improve the structure of their data models * Power BI report developers who wish to use advanced features like parameters and M coding in Power Query * Power BI practitioners who wish to optimise their models more effectively * Attendees wishing to prepare thoroughly for the DAX In A Day course COURSE OUTLINE Module 1 Getting And Shaping The Data * Understand what is meant by data model in the context of Power BI * Understand the consequences of data model design decisions * Understand consequences of Power BI’s data type handling * Understand data connection options Module 2 Basic Data Modelling * Understand basic data modelling * Understand basic data model types * Explore dimension tables and fact tables * Explore data connections Module 3 Getting Started With M (Power Query Language) * Get introduced to M * Understand key components and syntax Module 4 Understanding Logic Operators * Understand Transformations * Understand Join operation Module 5 Introduction To DAX * Get introduced to DAX and how can it be used * Understand working with parameters and DAX (lab combining the previous module) Module 6 Working With Functions - DAX CALCULATE And More * Understand working with functions * Understand the basics of the CALCULATE formula Module 7 Modelling With Power BI & DAX Best Practice * Gain familiarity with basic data modelling for business scenarios * Learn some best practices for working with Power BI
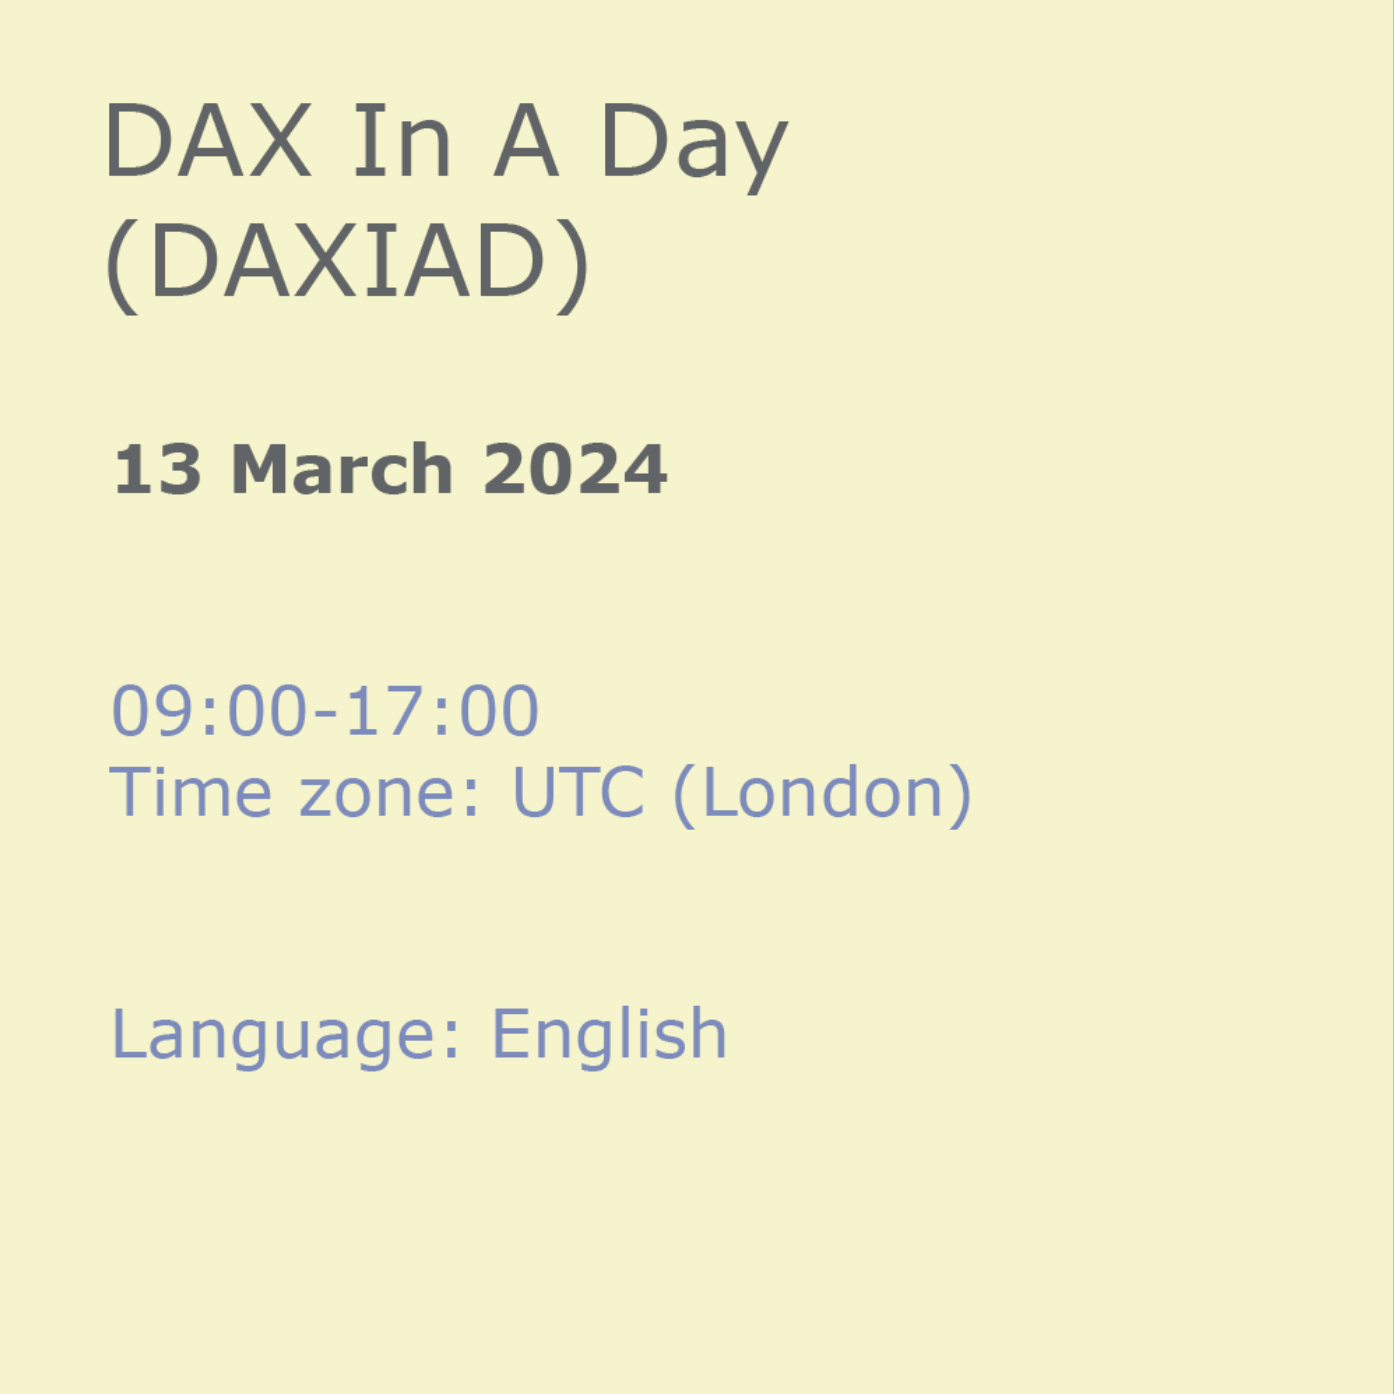
DAX In A Day (DAXIAD)
By Online Productivity Training
OVERVIEW Prerequisites—DIAD training and Advanced Data Modeling and Shaping training or equivalent working experience This course has been designed specifically for experienced model developers and gives a more advanced treatment of DAX formulas than either DIAD or the PL-300 course. We recommend that attendees have prior experience working with Power BI Desktop to create data models. During this course you will review: * Writing DAX formulas. * Defining calculated tables and columns. * Defining measures. * Using DAX iterator functions. * Modifying filter context. * Using DAX time intelligence functions. After completing this training, the attendees should be able to work with Data Analysis Expressions (DAX), perform calculations and define common business calculations for use in reports, address performance and functionality concerns. COURSE BENEFITS: * Understand Analytic queries in Power BI * Create calculated tables, calculated columns and measures * Use DAX functions and operators to build DAX formulas * Use DAX iterator functions * Create formulas that manipulate the filter context * Use DAX time intelligence functions WHO IS THE COURSE FOR? * Analysts with experience of Power BI wishing to develop more advanced formulas in DAX * Power BI developers who wish to deepen their understanding of the process of calculating formulas so as to make development faster and more reliable LAB OUTLINE Lab 1 Setup * Connect to data and understand the objectives of the future labs Lab 2 Write DAX Formulas For Power BI * Create a measure * Use variables in the measure definition Lab 3 Add Calculated Table And Columns * Duplicate a table * Create a hierarchy * Create a date table * Add calculated columns Lab 4 Add Measures To Power BI Desktop Models * Add an implicit measure to a report * Add an explicit measure * Add a compound measure * Add a quick measure Lab 5 Use DAX Iterator Functions In A Power BI Desktop Model * Complex summarization * Higher grain summarization * Create ranking measure Lab 6 Modify DAX Filter Context In Power BI Desktop Models * Apply Boolean expression filter * Remove filters: use ALL * Remove filters: use AllSelected * Preserve filters: use KeepFilters * HASONEVALUE * ISINSCOPE * Context transition Lab 7 Use DAX Time Intelligence Functions In Power BI Desktop Models * TOTALYTD * SAMEPERIODLASTYEAR * Calculate new occurrences * Snapshot calculations
Advanced Visualization with Power BI (AVIAD)
By Online Productivity Training
OVERVIEW Prerequisites—DIAD training or equivalent working experience This one-day course will cover Power BI report layouts and structure the agile process to creating Power BI data visualizations. It will help attendees to understand the art behind visualizations, the implications behind choosing the right charts, the impact of color, shape, and size, and finally the use of Power BI custom visuals. The course includes various design patterns of dashboards and reports, as well as best practices for authoring great reports and dashboards for business users. The course content is managed by the Power BI engineering team at Microsoft. There is no exam associated with the course. COURSE BENEFITS: * Understand the need for storytelling with data * Understand the agile process to creating Power BI data visualizations * Understand the art behind visualizations * Gain familiarity with Power BI report layouts and structure * Understand implications behind choosing the right charts * Gain familiarity with using Power BI custom visuals WHO IS THE COURSE FOR? * Power BI report developers who wish to improve the aesthetic quality of their reports * Power BI and other BI practitioners who would like to understand more about the theory of data visualization * BI practitioners who wish to create reports that communicate the meaning behind the data more clearly * Power BI users who would like to explore the types of chart and visual available that answer different types of business question COURSE OUTLINE Module 1 What Is Storytelling With Data? * Volume, Velocity and Variety * The importance of business questions * What is a story in this context? Module 2 The Science Behind Data Visualization * Basic problems to avoid * Memory and visualization * Ways to spark iconic, short-term and long-term memory Module 3 The Process Behind Data Visualization * Using an agile approach to report development * Data structure and data grain * Converting the story to a data model Module 4 Dashboards And Reports * Terminology and definitions * Dashboard layout and structure * Report layout and structure * Storyboarding * Drill-through, bookmarks, toggles and tooltips Module 5 Chart Selection * Charts for comparison * Time series * Proportions * Constructing effective tables, cards and slicers * Scatterplots Module 6 Accessibility And Custom Visuals * Report accessibility checklists * Custom visuals * Creating a custom R visual * Charticulator Module 7 Publishing And Formatting * Colour schemes * Making a Power BI theme * Use of fonts, icons and symbols * Sizing dashboard and report tiles * Sparklines, hyperlinks and images Module 8 Report Authoring - Best Practices * Design thought process * The audience * Defining the platform environment * The user experience * Visualization * Implementation and testing * Optimization Module 9 Dashboard And Goals Design * Tips and tricks * Best practices for dashboard design * Tracking business metrics with goals

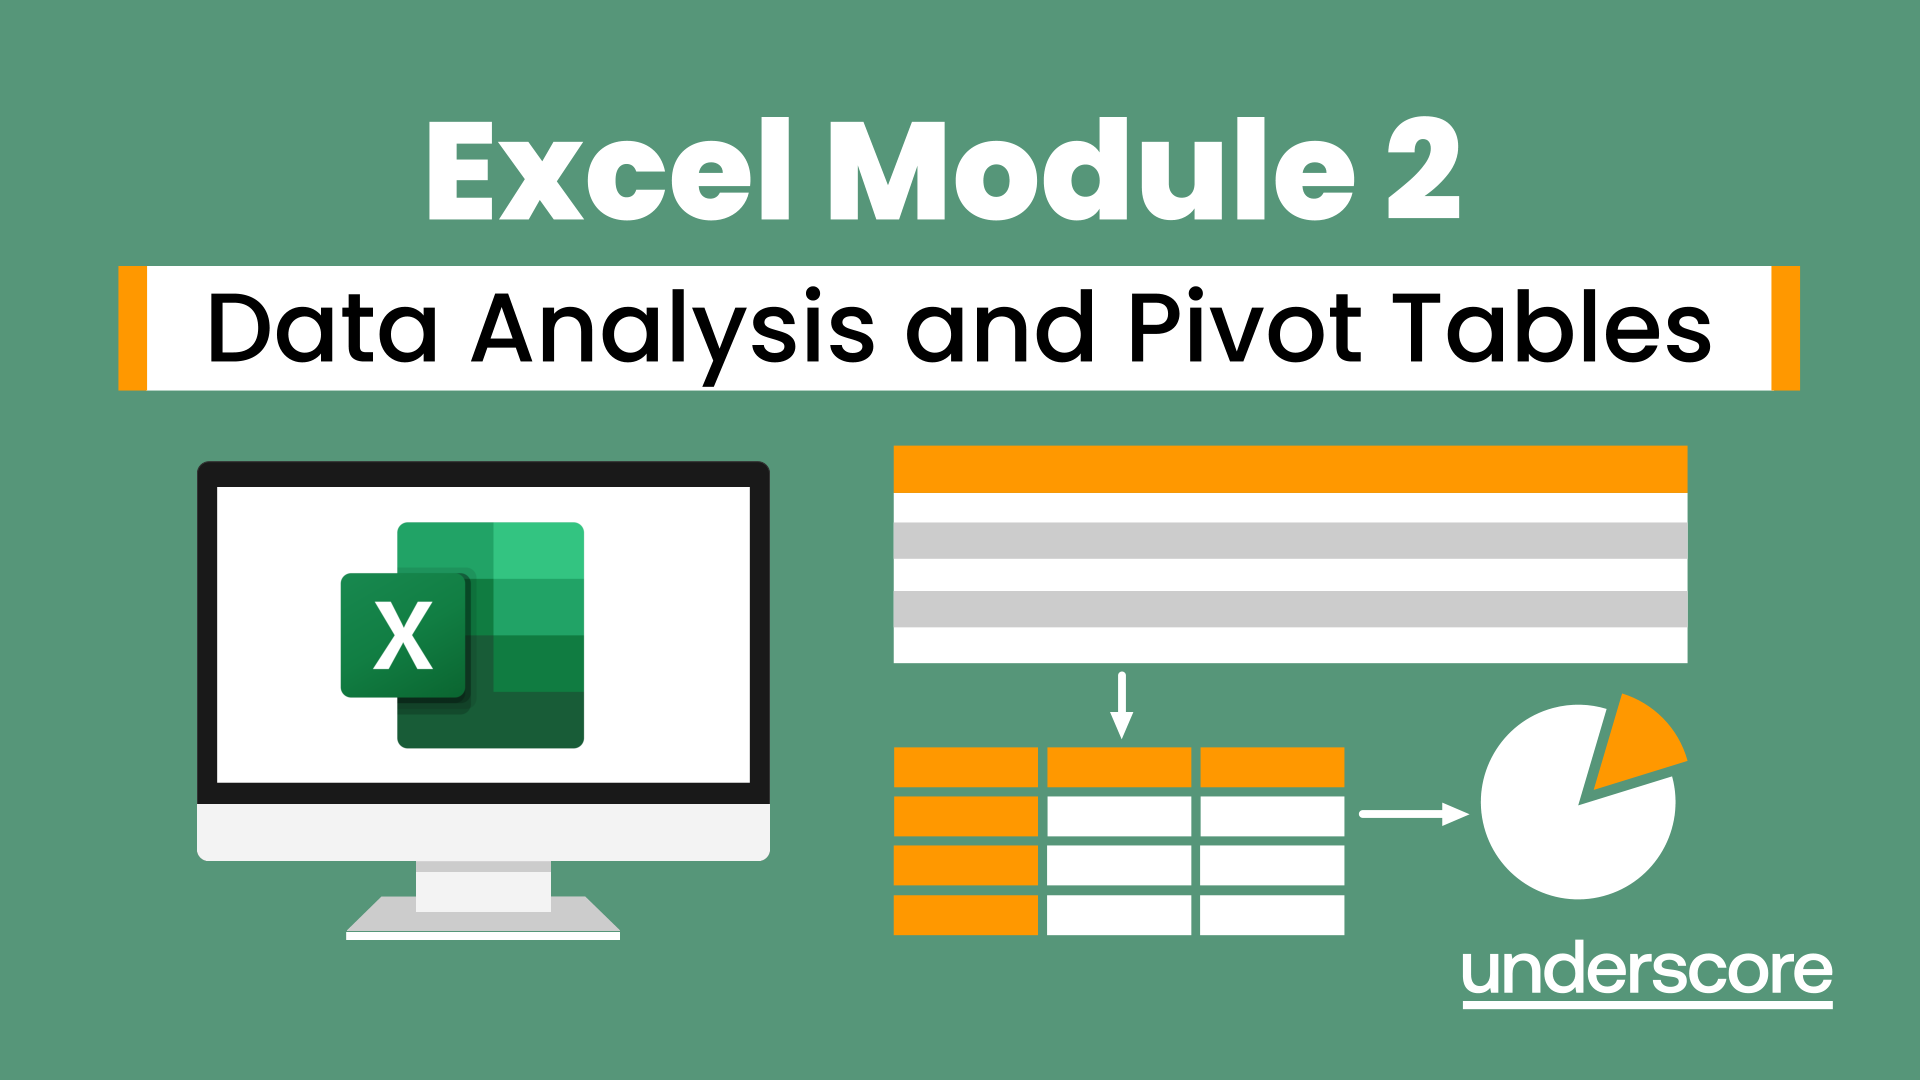
Excel Module 2 - Data Analysis and Pivot Tables
By Underscore Group
Expand your Excel knowledge and learn how to structure and analyse large data sets.
Supercharge your skills and career and learn in-demand knowledge needed to build business intelligence dashboards. This beginner to intermediate level course will introduce you to all the Power BI technologies i.e. Power Query, DAX, Data Modelling (Power Pivot), M, types of visualizations, etc.
The Real Estate Investment School is a four day course, that unravels the complexity of Investment Cash Flows through Advanced Modelling, Interpretation and Theory.

The Real Estate Analyst course has been taught non-stop to global real estate firms over the last 25 years, and is without doubt the core financial modelling training in your career portfolio. Whether you have an upcoming financial modelling test for a new job or an APC exam, the Real Estate Analyst course is the choice for you.

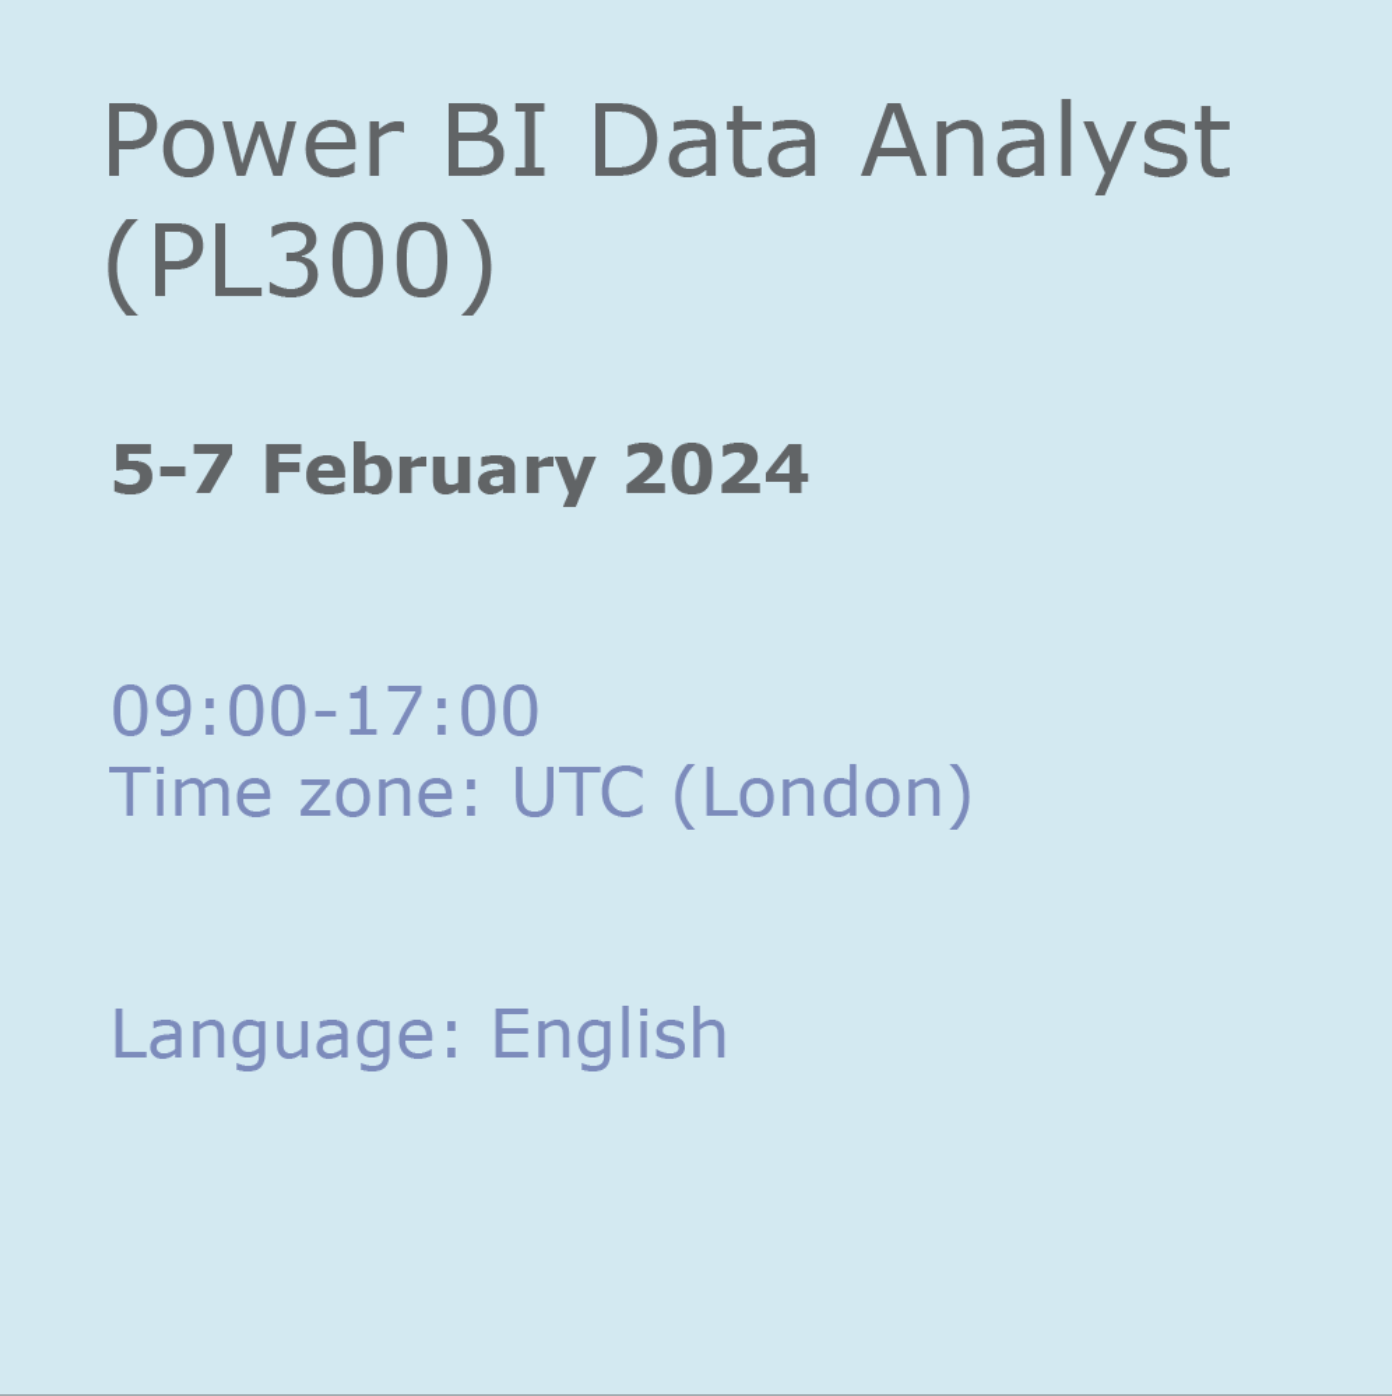
Power BI Data Analyst (PL300)
By Online Productivity Training
OVERVIEW This official Microsoft Power BI training course will teach you how to connect to data from many sources, clean and transform it using Power Query, create a data model consisting of multiple tables connected with relationships and build visualisations and reports to show the patterns in the data. The course will explore formulas created using the DAX language, including the use of advanced date intelligence calculations. Additional visualisation features including interactivity between the elements of a report page are covered as well as parameters and row-level security, which allows a report to be tailored according to who is viewing it. The course will also show how to publish reports and dashboards to a workspace on the Power BI Service. COURSE BENEFITS: * Learn how to clean, transform, and load data from many sources * Use database queries in Power Query to combine tables using append and merge * Create and manage a data model in Power BI consisting of multiple tables connected with relationships * Build Measures and other calculations in the DAX language to plot in reports * Manage advanced time calculations using date tables * Optimise report calculations using the Performance Analyzer * Manage and share report assets to the Power BI Service * Prepare for the official Microsoft PL-300 exam using Microsoft Official Courseware WHO IS THE COURSE FOR? * Data Analysts with little or no experience of Power BI who wish to upgrade their knowledge to include Business Intelligence * Management Consultants who need to conduct rapid analysis of their clients’ data to answer specific business questions * Analysts who need to upgrade their organisation from a simple Excel or SQL-based management reporting system to a dynamic BI system * Data Analysts who wish to develop organisation-wide reporting in the form of web reports or phone apps * Marketers in data-intensive organisations who wish to build visually appealing, dynamic charts for their stakeholders to use COURSE OUTLINE Module 1 Getting Started With Microsoft Data Analytics * Data analytics and Microsoft * Getting Started with Power BI Module 2 Get Data In Power BI * Get data from various data sources * Optimize performance * Resolve data errors Lab: Prepare Data in Power BI Desktop Module 3 Clean, Transform And Load Data In Power BI * Data shaping * Data profiling * Enhance the data structure Lab: Load Data in Power BI Desktop Module 4 Design A Data Model In Power BI * Introduction to data modelling * Working with Tables * Dimensions and Hierarchies Lab: Model Data in Power BI Desktop Module 5 Create Model Calculations Using DAX In Power BI * Introduction to DAX * Real-time Dashboards * Advanced DAX Lab 1: Create DAX Calculations in Power BI Desktop, Part 1 Lab 2: Create DAX Calculations in Power BI Desktop, Part 2 Module 6 Optimize Model Performance * Optimize the data model for performance * Optimize DirectQuery models Module 7 Create Reports * Design a Report * Enhance the Report Lab 1: Design a Report in Power BI Desktop, Part 1 Lab 2: Design a Report in Power BI Desktop, Part 2 Module 8 Create Dashboards * Create a Dashboard * Real-time Dashboards * Enhance a Dashboard Lab: Create a Power BI Dashboard Module 9 Perform Advanced Analytics * Advanced analytics * Data Insights through AI Visuals Lab: Perform Data Analysis in Power BI Desktop Module 10 Create And Manage Workspaces * Creating Workspaces * Sharing and managing assets Module 11 Manage Datasets In Power BI * Parameters * Datasets Module 12 Row-Level Security * Security in Power BI Lab: Enforce Row-Level Security