22 Business Analytics & Intelligence courses in Coventry
Get a 10% discount on your first order when you use this promo code at checkout: MAY24BAN3X
OVERVIEW -------------------------------------------------------------------------------- Data and visual analytics are emerging fields concerned with analysing, modelling, and visualizing complex high-dimensional data. It can be analysed and visualised with many languages like Python, R Programming and more. This course will help to attain the skills and give in-depth knowledge to the participant's enhanced way of modelling, analysing and visualizing techniques. The course will highlight practical challenges including composite real-world data and will also comprise several practical studies

OVERVIEW -------------------------------------------------------------------------------- Objective * Understanding the Importance of Business Analysis Model * Determining various techniques of Process Modelling * Understanding the scope of modelling * Efficiently mapping the business landscape * Analysing the enterprise structure * How to avoid project failures. * Learning efficient skills of being a successful business analyst. * Understand and document various techniques for the organization delivers value. * Successful project conversion * Building team, changing the organization and overcoming resistance. * Creating an effective Business Case.

Data Analysis
By Step Into Learning
Data analysis translates numbers and data into information that can be used to solve problems or track business performance. Data analysis produces graphs, charts, tables and reports. Data analysis is in high demand across all sectors, such as finance, consulting, manufacturing, pharmaceuticals, government and education. The ability to pay attention to detail, communicate well and be highly organised are essential skills for data analysts. They not only need to understand the data but be able to provide insight and analysis through clear visual, written and verbal communication. This course provides the knowledge and skills to help you hone your data analysis skills.

Data Analysis and Visualization with Microsoft Excel
By Mpi Learning - Professional Learning And Development Provider
This course is designed for students who already have foundational knowledge and skills in Excel and who wish to perform robust and advanced data and statistical analysis with Microsoft Excel using PivotTables, use tools such as Power Pivot and the Data Analysis ToolPak to analyze data and visualize data and insights using advanced visualizations in charts and dashboards in Excel.

Power BI Training
By FourSquare Innovations Ltd
FourSquare Training specialise in private, corporate Power BI courses delivered at your premises and tailored to your needs.
Commercial Awareness - Tools and Analysis
By Mpi Learning - Professional Learning And Development Provider
In today's fast-changing competitive environment, people in all roles need to have more commercial awareness and responsibility.

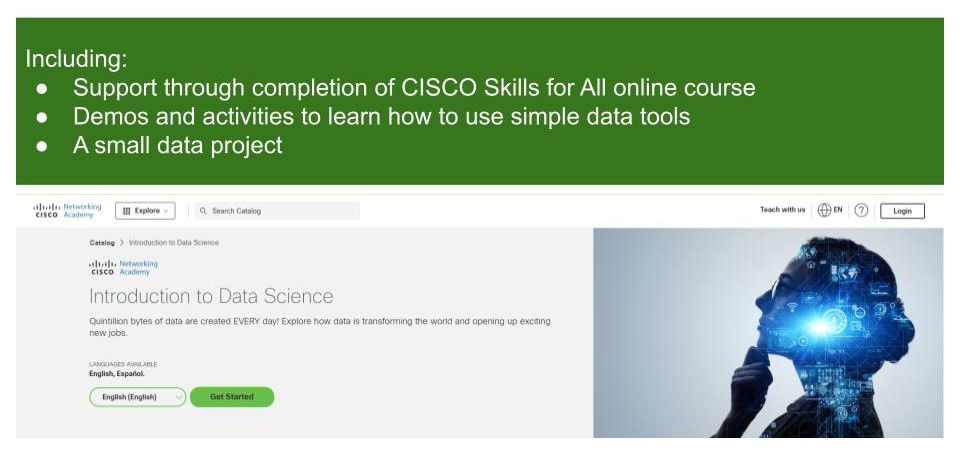
Introduction to Data Science
By futureCoders SE
Learn the basics of Data Science, combining a supported #CISCO Skills for All online course with practical learning and a project to help consolidate the learning.
Board Meeting Prep - Tips and Tools
By Ralph Ward
Board members face a huge amount of information and review before the board meeting. Here is step-by-step process for mastering your board meeting prep challenge.

Best Practice Board Meeting Tips
By Ralph Ward
For boards and staff, board meetings always involve too much time, too much effort, too much material to review, and too few tools to make governance effective. Here are the top tools, tips and timesavers boards around the world use to make your impossible boardroom tasks do-able.

Value Stream Mapping Workshop
By Centre for Competitiveness
The fundamental tool to identify waste, create effective process flow, reduce process cycle times, and implement process improvement.