43 Business Analytics & Intelligence courses delivered Live Online
Get a 10% discount on your first order when you use this promo code at checkout: MAY24BAN3X
Understanding Key Principles of Real Estate Modelling (Advanced Theoretical Course)
(5)By Bayfield Training
On this course, we will use case studies to enhance the delegates understanding of Real Estate financial appraisals, and help them fully appreciate the theory behind the numbers.

Power BI Data Analyst (PL300)
By Online Productivity Training
OVERVIEW This official Microsoft Power BI training course will teach you how to connect to data from many sources, clean and transform it using Power Query, create a data model consisting of multiple tables connected with relationships and build visualisations and reports to show the patterns in the data. The course will explore formulas created using the DAX language, including the use of advanced date intelligence calculations. Additional visualisation features including interactivity between the elements of a report page are covered as well as parameters and row-level security, which allows a report to be tailored according to who is viewing it. The course will also show how to publish reports and dashboards to a workspace on the Power BI Service. COURSE BENEFITS: * Learn how to clean, transform, and load data from many sources * Use database queries in Power Query to combine tables using append and merge * Create and manage a data model in Power BI consisting of multiple tables connected with relationships * Build Measures and other calculations in the DAX language to plot in reports * Manage advanced time calculations using date tables * Optimise report calculations using the Performance Analyzer * Manage and share report assets to the Power BI Service * Prepare for the official Microsoft PL-300 exam using Microsoft Official Courseware WHO IS THE COURSE FOR? * Data Analysts with little or no experience of Power BI who wish to upgrade their knowledge to include Business Intelligence * Management Consultants who need to conduct rapid analysis of their clients’ data to answer specific business questions * Analysts who need to upgrade their organisation from a simple Excel or SQL-based management reporting system to a dynamic BI system * Data Analysts who wish to develop organisation-wide reporting in the form of web reports or phone apps * Marketers in data-intensive organisations who wish to build visually appealing, dynamic charts for their stakeholders to use COURSE OUTLINE Module 1 Getting Started With Microsoft Data Analytics * Data analytics and Microsoft * Getting Started with Power BI Module 2 Get Data In Power BI * Get data from various data sources * Optimize performance * Resolve data errors Lab: Prepare Data in Power BI Desktop Module 3 Clean, Transform And Load Data In Power BI * Data shaping * Data profiling * Enhance the data structure Lab: Load Data in Power BI Desktop Module 4 Design A Data Model In Power BI * Introduction to data modelling * Working with Tables * Dimensions and Hierarchies Lab: Model Data in Power BI Desktop Module 5 Create Model Calculations Using DAX In Power BI * Introduction to DAX * Real-time Dashboards * Advanced DAX Lab 1: Create DAX Calculations in Power BI Desktop, Part 1 Lab 2: Create DAX Calculations in Power BI Desktop, Part 2 Module 6 Optimize Model Performance * Optimize the data model for performance * Optimize DirectQuery models Module 7 Create Reports * Design a Report * Enhance the Report Lab 1: Design a Report in Power BI Desktop, Part 1 Lab 2: Design a Report in Power BI Desktop, Part 2 Module 8 Create Dashboards * Create a Dashboard * Real-time Dashboards * Enhance a Dashboard Lab: Create a Power BI Dashboard Module 9 Perform Advanced Analytics * Advanced analytics * Data Insights through AI Visuals Lab: Perform Data Analysis in Power BI Desktop Module 10 Create And Manage Workspaces * Creating Workspaces * Sharing and managing assets Module 11 Manage Datasets In Power BI * Parameters * Datasets Module 12 Row-Level Security * Security in Power BI Lab: Enforce Row-Level Security
PL300 Revision Day (PL300REV)
By Online Productivity Training
OVERVIEW Prerequisites—this is a day of supervised revision for anyone who wishes to take the PL-300 exam so we expect you to have attended a PL-300 course, either taught or on your own, before attending this day of revision. We are happy for attendees to join the course if you have taken the PL-300 with us or with another provider. In the morning we look at questions from the PL-300 exam, grouped by subject area. For each question we show you the correct answer and then explain why that is the correct answer. After lunch everyone tries a practice exam under exam conditions and we finish the day with clarification on the subjects or specific questions that the class is finding hard. The cost of the course includes a free voucher to take the exam, so please don’t buy your own separately. If you do so we cannot reimburse you with the cost of the exam. COURSE BENEFITS: * Discover the parts of the course on which to focus most attention * Become familiar with the styles and formats of the exam questions * Alert yourself to some of the particularly tricky questions * Familiarise yourself with the style of the 'case study' question * Practice an exam under real exam conditions * Get a feel for the time you need to devote to the normal questions and to the case study WHO IS THE COURSE FOR? * Power BI report developers who need PL-300 Certification to apply for a job * Business Intelligence specialists who wish to enhance their career prospects with a PL-300 Certification * Anyone who wishes to maximise their chances of passing the PL-300 Power BI Data Analyst exam COURSE OUTLINE Module 1 Structure Of The Exam * Registration for the exam and setup of your workspace * The percentage of marks devoted to each subject area * Types of questions used in the exam * Advised timing for the normal questions and for the case study question Module 2 Individual Exam Question Practice * The exam questions are divided into subject areas and for each question… * We consider the question and try to answer it * We view the answer * Where necessary, we look at an in-depth explanation of why that is the correct answer * Examine case study questions and how to treat these differently from the normal questions Module 3 Practice Exam Under Exam Conditions * Attendees take a practice exam * Attendees receive a mark, broken down into subject areas Module 4 Exam Question Practice Focussed On Tricky Areas * Together, based on the results of attendees’ exam results we decide which areas on which to focus * More practice on individual exam questions using the same style as in Module 2

University of Cambridge & Bayfield Training - Real Estate Financial Modelling Certificate (Online Self-Study)
(5)By Bayfield Training
Bayfield Training and the University of Cambridge Department of Land Economy This prestigious eight-week online Real Estate course is suitable for modellers new to Real Estate and experienced Real Estate Analysts looking to formalise their skill set. This course will equip you with skills to start building your own financial models and the certificate will give your employers and colleagues reassurance of your expertise. If you want to enhance your financial modelling skills over an extended period, the Real Estate Financial Modelling Certificate is the course for you. This online real estate course has been put together exclusively for the Real Estate Financial Modelling certificate, using state of the art digital resources such as animations, video-steps, digital whiteboard and video-interactions as well as the spreadsheets, text based resources and tutor contact you would expect from any of Bayfield Training’s classroom based courses. Assessment is in the form of a guided model build exercise and written model appraisal. Participants benefit from an additional months access to the course platform after submission of the assessment. ON THIS COURSE YOU WILL: * Become a competent model builder, building Real Estate Financial Models from scratch * Learn tricks and concepts from financial modelling experts with decades of experience in practice and academia * Learn how to use Real Estate Financial Models to make informed investment decisions * Learn at a consistent pace over 8 weeks allowing you to take the time to fully grasp this important skill THIS COURSE IS SUITABLE FOR: * Chartered Surveyors * Asset Managers * Financial Controllers * Financial Analysts * Investment Managers * Property Managers * Real Estate Students/Recent Graduates Course Outline: Module 1 - Economic Context Introduction to Real Estate Asset Modelling and how it relates to and is distinct from Econometric Models. * Introduction to Real Estate Asset Modelling and how it relates to and is distinct from Econometric Models. * Why Real Estate Asset Modelling is important * Understanding the occupier, asset and development markets and the relevant modelling approaches for each * Real Estate Sub-Sector Key Performance Indicators * Introduction to conventional valuations and financial mathematics * Understanding and minimising errors in Financial Models Module 2 - Cash Flow Fundamentals Constructing a financial model from first principles. * Understanding all the components of a basic cash flow model * Understand why Corporate Finance Models and Real Estate Models are different * Financial Model Design * Making the link between valuations, income mathematics and discounted cash flows * Internal Rate of Return, Net Present Value,Worth and other metrics * Features and techniques to aid fast model building Module 3 - Developing the Cash Flow Adapting financial models for different periodicities and building rent functions for different rent behaviour. * Understanding how leases vary with respect to rent over time: Rent Reviews, Break Clauses, Rent Free Periods, Lease Expiries etc. * Developing the concept of a Rent Function in Excel * Logic mathematics and Logic functions * Projecting rent to adapt to different lease contracts and growth patterns * Alternative solutions to Logic functions * Comparative analysis of lease structures in different jurisdictions and adapting financial models Module 4 - Real Estate Data Understanding the different sources of data, constructing basic time series models and recognising basic patterns. * Key Property market indicators * Characteristics and application of key input metrics for Real Estate Appraisals * Understanding the eight components of Real Estate Price Dynamics * Awareness of the different sources of data * Reading and using general property market reports * Constructing basic time series models and recognising basic patterns Module 5 - Development Appraisals Constructing a development appraisal from first principles and understanding development return metrics. * Understanding the key components of a development project * Understanding the difference between development and investment appraisals * Residual Appraisals and Profit Calculations * Cost orientated cash flows and phased sales * Cumulative construction cost patterns: incidental, fixed, loaded and S-curve * Development return metrics and Modified IRRs Module 6 - Multi-let Cash Flows Constructing an advanced multi-let cash flow model and learn different techniques to build flexible rent functions. * Multi-let and portfolio model design principles * Building complex date functions and date series * The three multi-let rent projection techniques * Perpendicular Rent Functions * Incorporate advanced rent adjustments into the Rent Function * Incorporate sector and period varying rental growth rates * Simplifying OPEX and CAPEX projections * Discounting techniques on complex and volatile cash flows Module 7 - Project Finance Constructing a flexible Real Estate Debt Finance model. * Revision of the Mathematics of amortisation and debt finance * Basic senior debt models and geared net cash flow * LTV, IRR and Interest Rate Dynamics * Flexible term, repayment options and deferred interest * Loan covenant tests * Understanding different tranches of debt * Understanding how complex debt structures impact the returns to different parties Module 8 - Model Interpretation and Risk Analysis Learn how to read, analyse and report on real estate financial models. * Understand how to read models and develop an investment narrative * Visualise model outputs using graph functions, conditional formatting, dynamic symbols and dashboards * Learn how to use built-in Sensitivity, Scenario Analysis tools and third-party add-ins * Learn how to construct varied project scenarios in a systematic way * Introduction to Monte Carlo Analysis and VBA * Optimising sale dates and other parameters * Create well written, attractive and persuasive reports Included in the Course * Bayfield Training and University of Cambridge Accredited Certificate & LinkedIn Proficiency Badge * 64 CPD Hours * 1 Month Post-Course Access to the Digital Platform - 12 Months Post-Course Access to the Platform can be purchased for an additional fee * Course Files * Q&A Webinars and Guest Speaker Webinars * Further Learning Resources (Reading, Files and Videos) * Post Course Support - Two Months of Questions & Answers 2024 Cohort Dates Include: * 3rd June to 29th July * 5th August to 25th September 2024 * 30th September to 25th November For more information, please contact Sam on the Bayfield Training Sales team: E - s.musgrave@bayfieldtraining.com T - 01223 517851 W - www.bayfieldtraining.com [https://www.bayfieldtraining.com/]

Dashboard In A Day (DIAD)
By Online Productivity Training
OVERVIEW DIAD is a one-day, hands-on workshop for business analysts, covering the breadth of Power BI capabilities. The course focuses on five practical Labs and at the end of the day, attendees will better understand how to: * Connect and transform data from a variety of data sources. * Define business rules and KPIs. * Explore data with powerful interactive visuals. * Build stunning reports. * Share their dashboards with their team business partners and publish them to the web. The course content is managed by the Power BI engineering team at Microsoft. There is no exam associated with the course. COURSE BENEFITS: * Learn how to clean, transform, and load data from various sources * Create and manage a data model in Power BI consisting of multiple tables connected with relationships * Build Measures and other calculations in the DAX language to plot in reports * Manage and share report assets to the Power BI Service WHO IS THE COURSE FOR? * Data Analysts and Management Consultants with little or no experience of Power BI who wish to upgrade their knowledge to include Business Intelligence * Analysts looking for a quick introduction to Power BI who don’t have the time for the full three day PL-300 course * Marketers in data-intensive organisations who need new tools to build visually appealing, dynamic charts for their stakeholders to use LAB OUTLINE Lab 1 Accessing & Preparing The Data * Load data from Excel and CSV sources * Manipulate the data to prepare it for reporting * Prepare tables in Power Query and load them into the data model Lab 2 Data Modelling And Exploration * Create a range of different charts * Highlight and cross-filter * Create new groups and hierarchies * Add new measures to the model Lab 3 Data Visualization * Add conditional formatting to a report * Add logos to a filter * Import a custom visual * Apply a custom theme * Add bookmarks to the report to tell a story Lab 4 Publishing A Report And Creating A Dashboard * Create a Workspace in the Power BI Service * Publish a report to the Service * Create a Dashboard and pin visuals to it * Generate and view insights Lab 5 Collaboration * Share a Dashboard * Access a Dashboard on a Mobile Device

Advanced Data Modelling and Shaping (MSIAD)
By Online Productivity Training
OVERVIEW Prerequisites—DIAD training or equivalent working experience This one-day course will cover using Power BI Desktop to import and shape data from a variety of sources. It will also walk through Power BI capabilities you can use to enhance the data model for your business users. The course covers key aspects of how to create a great data model to meet your business needs, various features in Power BI used to enhance data models so you can build great reports, and an introduction to DAX to create calculations. After completing this training, the attendees should be able to import data from a variety of data sources into Power BI, shape the data, create the data model, and write DAX functions to the Power BI model. COURSE BENEFITS: * Understand the Power BI Desktop data model, its components and most effective schemas * Describe concepts of calculated columns and measures * Create queries using M * Create calculations with DAX * Understand the use of functions * Create and optimize a data model * Understand the consequences of data model design decisions WHO IS THE COURSE FOR? * Power BI report developers who wish to improve the structure of their data models * Power BI report developers who wish to use advanced features like parameters and M coding in Power Query * Power BI practitioners who wish to optimise their models more effectively * Attendees wishing to prepare thoroughly for the DAX In A Day course COURSE OUTLINE Module 1 Getting And Shaping The Data * Understand what is meant by data model in the context of Power BI * Understand the consequences of data model design decisions * Understand consequences of Power BI’s data type handling * Understand data connection options Module 2 Basic Data Modelling * Understand basic data modelling * Understand basic data model types * Explore dimension tables and fact tables * Explore data connections Module 3 Getting Started With M (Power Query Language) * Get introduced to M * Understand key components and syntax Module 4 Understanding Logic Operators * Understand Transformations * Understand Join operation Module 5 Introduction To DAX * Get introduced to DAX and how can it be used * Understand working with parameters and DAX (lab combining the previous module) Module 6 Working With Functions - DAX CALCULATE And More * Understand working with functions * Understand the basics of the CALCULATE formula Module 7 Modelling With Power BI & DAX Best Practice * Gain familiarity with basic data modelling for business scenarios * Learn some best practices for working with Power BI
DAX In A Day (DAXIAD)
By Online Productivity Training
OVERVIEW Prerequisites—DIAD training and Advanced Data Modeling and Shaping training or equivalent working experience This course has been designed specifically for experienced model developers and gives a more advanced treatment of DAX formulas than either DIAD or the PL-300 course. We recommend that attendees have prior experience working with Power BI Desktop to create data models. During this course you will review: * Writing DAX formulas. * Defining calculated tables and columns. * Defining measures. * Using DAX iterator functions. * Modifying filter context. * Using DAX time intelligence functions. After completing this training, the attendees should be able to work with Data Analysis Expressions (DAX), perform calculations and define common business calculations for use in reports, address performance and functionality concerns. COURSE BENEFITS: * Understand Analytic queries in Power BI * Create calculated tables, calculated columns and measures * Use DAX functions and operators to build DAX formulas * Use DAX iterator functions * Create formulas that manipulate the filter context * Use DAX time intelligence functions WHO IS THE COURSE FOR? * Analysts with experience of Power BI wishing to develop more advanced formulas in DAX * Power BI developers who wish to deepen their understanding of the process of calculating formulas so as to make development faster and more reliable LAB OUTLINE Lab 1 Setup * Connect to data and understand the objectives of the future labs Lab 2 Write DAX Formulas For Power BI * Create a measure * Use variables in the measure definition Lab 3 Add Calculated Table And Columns * Duplicate a table * Create a hierarchy * Create a date table * Add calculated columns Lab 4 Add Measures To Power BI Desktop Models * Add an implicit measure to a report * Add an explicit measure * Add a compound measure * Add a quick measure Lab 5 Use DAX Iterator Functions In A Power BI Desktop Model * Complex summarization * Higher grain summarization * Create ranking measure Lab 6 Modify DAX Filter Context In Power BI Desktop Models * Apply Boolean expression filter * Remove filters: use ALL * Remove filters: use AllSelected * Preserve filters: use KeepFilters * HASONEVALUE * ISINSCOPE * Context transition Lab 7 Use DAX Time Intelligence Functions In Power BI Desktop Models * TOTALYTD * SAMEPERIODLASTYEAR * Calculate new occurrences * Snapshot calculations
Data storytelling
By Fire Plus Algebra
Data has become the most important resource for every organisation – but the insights gained from data analysis will only ever be truly valuable if they can be clearly expressed to other people. This course is for anybody who works with data, and needs to communicate the meaning that's in the numbers to colleagues, customers, bosses or external stakeholders. It will give you or your team the confidence and skills to translate raw data into compelling visual stories for your key audiences. The principles and skills covered apply to the simplest PowerPoint chart, to more complex interactive visualisations. We’ll work with you before the course to ensure that we understand your organisation and what you’re hoping to achieve. Sample learning content Session 1: What makes a great data-driven story * The key elements of a successful infographic or presentation. * Industry best practice, and discussion of good (and bad) examples. * A simple framework for identifying the Audience, Story and Action. Session 2: Data in context * How to balance function and aesthetic appeal. * Identifying the right graph, chart, infographic or other visual. * Framing the data and providing contextual information. Session 3: Designing for the human brain * Using colours to add emphasis and meaning. * Design and layout principles, and creating hierarchies of information. * The principle of ‘self-sufficiency’, and removing clutter. Session 4: Navigation and narrative * Tailoring visualisations for different types of communications. * Structuring presentations and longer reports. * Thinking in layers to create interactive dashboards. Delivery We deliver our courses over Zoom, to maximise flexibility. The training can be delivered in a single day, or across multiple sessions. All of our courses are live and interactive – every session includes a mix of formal tuition and hands-on exercises. To ensure this is possible, the number of attendees is capped at 16 people. Tutor Alan Rutter is the founder of Fire Plus Algebra. He is a specialist in communicating complex subjects through data visualisation, writing and design. He teaches for General Assembly and runs in-house training for public sector clients including the Home Office, the Department of Transport, the Biotechnology and Biological Sciences Research Council, the Health Foundation, and numerous local government and emergency services teams. He previously worked with Guardian Masterclasses on curating and delivering new course strands, including developing and teaching their B2B data visualisation courses. He oversaw the iPad edition launches of Wired, GQ, Vanity Fair and Vogue in the UK, and has worked with Condé Nast International as product owner on a bespoke digital asset management system for their 11 global markets. Testimonial “I was familiar with Alan’s work as a Guardian Masterclass instructor on data visualisation and digital journalism, which made it easy for me to recommend him for onsite training at the Liverpool School of Tropical Medicine. We had a large group of people interested in honing their abilities to depict their research and stories in engaging ways. Alan’s course provided great insight about common communication pitfalls and how to avoid them, how to become better communicators by understanding the audience diversity, and it showcased some great online tools for creating infographics. This should be mandatory training for all students, academics, report writers and those involved with conveying research to the media as it will help increase the clarity and accessibility of our own research stories.” Dr Lee Haines | Liverpool School of Tropical Medicine

Tableau Desktop Training - Advanced Analyst
By Tableau Training Uk
This 3 day Tableau Desktop Advanced Training course is designed for professionals who have been working with Tableau for some time and are looking to dive deeper and learn analytical use cases that utilise Tableaus advanced features. It is also a perfect refresher course if you want to upgrade your skills to the latest features. -------------------------------------------------------------------------------- Public Course Options EXTEND YOUR KNOWLEDGE OF TABLEAU IN THIS HANDS-ON COURSE TRAINING £1,195 per person + VAT 3 Day live virtual course 12 Months access to online course -------------------------------------------------------------------------------- This 3 day Tableau Desktop Advanced Training course is designed for the professional who has been working with Tableau for some time and is looking to dive deeper. You will review all calculation types and apply Table Calculations and Level of Detail Expressions in multiple use cases. You will also learn advanced techniques for analysing time series data, cohorts and survey data. You will learn advanced mapping and dashboard techniques to help improve the insights gained for your target audience. You will be introduced to the latest features together with practical use cases for getting the most benefit from them. Attendees should have a deep understanding of the fundamental concepts of building Tableau worksheets and dashboards and be comfortable with the techniques learnt in the Foundation and Analyst courses. At the end of this course you will be able to apply and combine some of the more complex capabilities and techniques that Tableau has to offer. In addition to our regular 2 day syllabus we have added an additional day so that we can add learning for many new features introduced into Tableau over the last couple of years. -------------------------------------------------------------------------------- LIVE COACHING AND Q&A ACCESS In addition to the 3 day live and interactive course, delegates also receive 6 weeks live access to our Coaching and Q&A calls that take place 3 times each week. Delegates have found these to be highly beneficial to enhance their learning experience as well as assisting with applying the learning from the course to practical working deliverables on their own data. THE COURSE INCLUDES THE FOLLOWING TOPICS: RECAP: CALCULATIONS * Review of Number Functions * Review of String Functions * Review of Date Functions * Review of Type Conversions * Review of Logical Functions * Review of Aggregate Functions * Alternatives to Calculations * 2 Hands-on exercises GETTING THE MOST FROM TABLE CALCULATIONS * What are and when to use Table Calculations * What Table Calculation Types are there? * Defining the Scope and Direction of calculations * Using Table Calculations in Calculated Fields * How do Filters work with Table Calculations? * 7 Hands-on exercises LODS - LEVEL OF DETAIL EXPRESSIONS * Overview * FIXED LOD * How do Filters work with LODs? * INCLUDE LOD * EXCLUDE LOD * Nesting LODs * Comparing the various Calculation Types * 5 Hands-on exercises ADVANCED TECHNIQUES FOR ANALYSING TIME-BASED DATA * Creating Sparklines * Creating Slope Charts * Creating Control Charts * Creating Bump Charts * 4 Hands-on exercises ANALYSING BEHAVIOURS IN DATA * Creating Cohort Analysis * Analysing Survey Data * 2 Hands-on exercises ADVANCED TECHNIQUES FOR MAPPING * Mapping Distance from a point * Normalising map areas with Hexbins * Combining Spatial & Data Files * 3 Hands-on exercises ADVANCED CONSIDERATIONS FOR DASHBOARDS * Identifying your Audience * Using Containers and Layout * Considerations for Dashboard Elements * Sheet swapping * Adding Dashboard Actions to Context * 2 Hands-on exercises -------------------------------------------------------------------------------- IN ADDITION TO THE REGULAR SYLLABUS WE WILL ALSO COVER THE FOLLOWING NEW FEATURES : * Viz in Tooltips * Set Actions * Parameter Actions * Show/Hide Containers * Animations * Dashboard Navigation Button * Replace Worksheet in a Dashboard (DB) * Show/Hide Sort Controls * Vector Maps * Customisable reference line tooltips * Automatic dashboard phone layouts * Export to PowerPoint * Transparent worksheet backgrounds * Density Mark Type (New Heatmap) * Dashboard Extensions * Step and Jump Lines * Dashboard Grids * Nested sorting improvements * Ask Data * Explain Data * Spatial Calculations * Negative values on log axis * Additional clustering functionality * Enhanced cross-database join control -------------------------------------------------------------------------------- This training course includes over 35 hands-on exercises and quizzes to help participants “learn by doing” and to assist group discussions around real-life use cases. A comprehensive training manual is provided together with all the data, starter and solution Tableau Workbooks required for the training. Students must use their own laptop with an active version of Tableau Desktop 2020.1 (or later) pre-installed. -------------------------------------------------------------------------------- WHAT PEOPLE ARE SAYING ABOUT THIS COURSE "Course was fantastic and completely relevant to the work I am doing with Tableau. I particularly liked Steve's method of teaching and how he applied the course material to 'real-life' use-cases." Richard W., Dashboard Consulting Ltd "This course was extremely useful and excellent value. It helped me formalise my learning and I have taken a lot of useful tips away which will help me in everyday work." Lauren M., Baillie Gifford "I would definitely recommend taking this course if you have a working knowledge of Tableau. Even the little tips Steve explains will make using Tableau a lot easier. Looking forward to putting what I've learned into practice." Aron F., Grove & Dean "Steve is an excellent teacher and has a vast knowledge of Tableau. I learned a huge amount over the two days that I can immediately apply at work." John B., Mporium
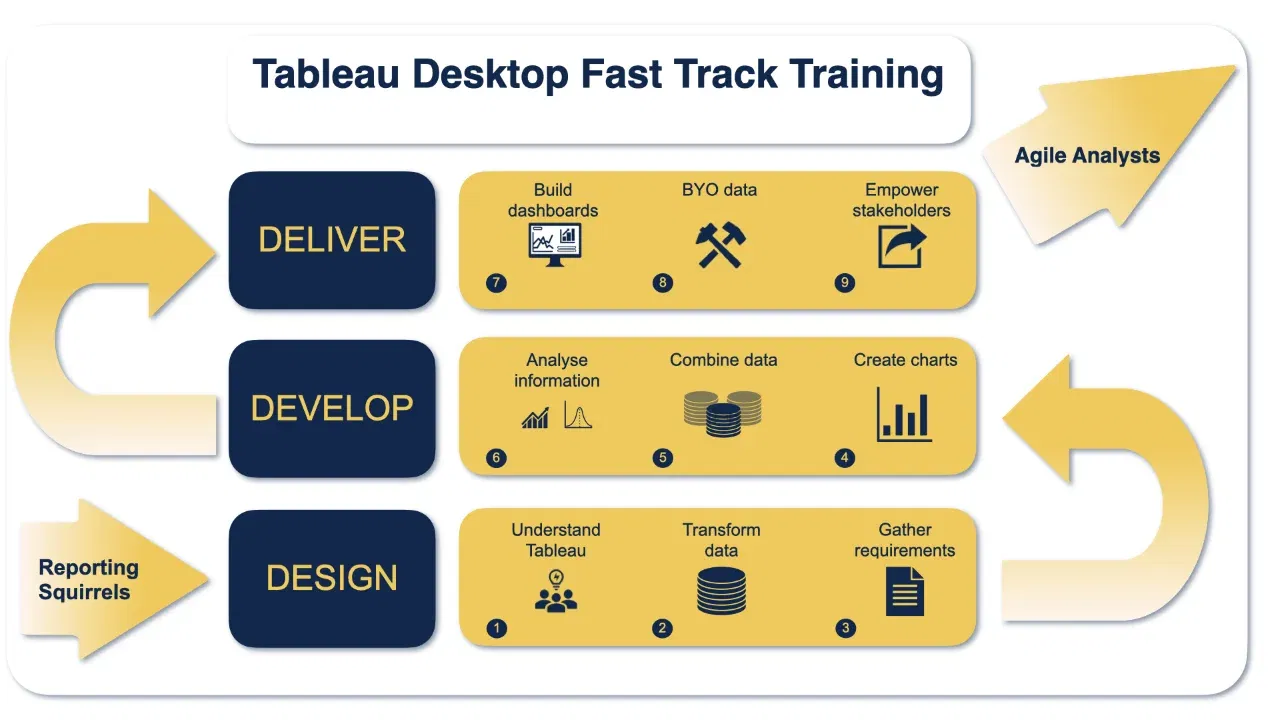
Tableau Training On Tap - Fast Track
By Tableau Training Uk
Tableau is an intuitive and simple tool to learn. This Tableau training course is a jumpstart to getting report writers and analysts who are self-taught or have no previous knowledge to being productive. It covers everything from connecting to data, through to creating interactive dashboards with a range of visualisations in three days. Having a quick turnaround from starting to use Tableau, to getting real, actionable insights means that you get a swift return on your investment. At the end of this course, you will be able to communicate insights more effectively, enabling your organisation to make better decisions, quickly. This accelerated approach is key to getting engagement from within your organisation so everyone can immediately see and feel the impact of the data and insights you create. Our Tableau Desktop Fast Track course combines all of our Foundation (Fundamentals) and Analyst (Intermediate) content into a 3 day live online course with added access to online bonus content of 3 additional modules. Gathering Requirements, Bring Your Own Data and Engaging Users. -------------------------------------------------------------------------------- WHAT DO YOU GET? This course is delivered live virtually and has all material provided through our online portal, together with email support and live coaching sessions. The full program includes all of the following elements: * 3 days of live and interactive instructor-led sessions delivered by an expert Tableau Trainer * 6 weeks access to our live coaching program delivered by expert Tableau coaches * 50+ practical exercises to practice what you learn * 12 months access to video’s that walk you through the theory and exercise solutions * Practical advice, tools and resources for using Tableau in the real world * The three additional online modules provide: * Clarity on the approach to gathering dashboard requirements in a way that can be translated into dashboard designs. * An agile and iterative development process that delivers products that meet user needs more quickly and effectively. * An understanding of how end users will interact with dashboards to ensure that designers deliver actionable results. THE SYLLABUS PHASE 1: DESIGN MODULE 1: UNDERSTAND TABLEAU * What is possible * How does Tableau deal with data * Know your way around * Review of Type Conversions * How do we format charts * Dashboard basics – My first Dashboard MODULE 2: TRANSFORM DATA * Connecting to and setting up data in Tableau * Modifying data attributes * How Do I Structure my Data – Groups & Hierarchies, Visual Groups * How Tableau Deals with Dates – Using Discrete and Continuous Dates, Custom Dates * How do I create calculated fields and why? – Creating Calculated Fields, Types of calculated fields, Row Level v Aggregations, Aggregating dimensions in calculations, Changing the Level of Detail (LOD) of calculations – What, Why, How MODULE 3: GATHER REQUIREMENTS(ONLINE CONTENT ONLY) * Brainstorm and assess possible priorities * Pitfalls to avoid * Gather requirements PHASE 2: DEVELOP MODULE 4: CREATE CHARTS * Charts that Compare Multiple Measures – Measure Names and Measure Values, Shared Axis Charts, Dual Axis Charts, Scatter Plots * Showing progress over time * Creating Tables – Creating Tables, Highlight Tables, Heat Maps * Showing Relational & Proportional Data – Pie Charts, Donut Charts, Tree Maps * Making things dynamic with parameters MODULE 5: COMBINE DATA * Relationships * Joining Tables – Join Types, Joining tables within the same database, cross database joins, join calculations * Blending – How to create a blend with common fields, Custom defined Field relationships and mismatched element names, Calculated fields in blended data sources * Unions – Manual Unions and mismatched columns, Wildcard unions * Data Extracts – Creating & Editing Data extracts MODULE 6: ANALYSE INFORMATION * Table Calculations * Sets, Reference Lines, Trends and Forecasting * Answering spatial questions – Mapping, Creating a choropleth (filled) map, Using your own images for spatial analysis, Mapping with spatial files * Advanced charts * Bar in Bar charts * Bullet graphs * Creating Bins and Histograms * Creating a Box & Whisker plot * Viz in Tooltips PHASE 3: DESIGN MODULE 7: BUILD DASHBOARDS * Using the Dashboard Interface * Device layouts * Dashboard Actions – Set actions, Parameter actions * Viz in Tooltips for Dashboards * Dashboard containers – Horizontal & Vertical containers, Hidden containers * Navigate between dashboards * Telling data driven stories MODULE 8: BRING YOUR OWN DATA * Design * Best Practices & Resources * Wireframe templates * Questions * Process * Start building and testing MODULE 9: EMPOWER STAKEHOLDERS * What is Tableau Server * Publishing & permissions * How can your users engage with content * The Tableau ecosystem * Review your progress * Your next steps -------------------------------------------------------------------------------- HOW MUCH OF YOUR TIME WILL THIS TAKE? Delegates are also provided 6 weeks access to our Tableau Coaching. We run Live Q&A sessions from 4pm-5pm on a Monday (Connecting to Data and Calculated Fields), 2pm-3pm Friday (Creating Charts) & 4pm-5pm Friday (Dashboard Design). The coaching helps delegates to transition from the theory of using Tableau to its practical use. We’d be expecting them to apply the exercises you’ll be doing during the course, onto your own data after the course. In our experience, this is the best way to increase both understanding and long term memory retention. The live coaching also acts as a troubleshooting platform for any practical issues that delegates need to overcome in the real world. Delegates also have 12 months access to all of the training material covered in the course in the form of an online portal (this includes theory videos, exercise solution videos, exercise materials and even quizzes). We have a growing LinkedIn community that delegates are encouraged to join and participate in. We regularly post useful blog posts and additional training that will enhance the Tableau journey and understanding. -------------------------------------------------------------------------------- We help teams using Tableau to transform in the following ways : * From a disjointed understanding of Tableau – To being familiar with Tableau terminology and capability * From ad-hoc data uploads and error prone calculations – To reusable data connections and robust metrics * From disjointed stakeholder questions – To clear and concise requirements that lead to decision making * From being unsure how difficult Tableau will be to learn – To being able to develop standard charts and tables in Tableau with dynamic reporting capabilities * From manually combining data for each analytical task – To dynamically combining data from multiple tables for analysis * From being unsure how to answer analytical questions and what options there are – To being equipped with multiple actionable, dynamic, analytical use cases * From not knowing Why, When and How to create Dashboards or Story’s – To being able to combine analysis to answer complex questions and tell data driven stories * From using demo data theory – To Delivering value [Answering questions] on their own data * From spending lots of time answering colleagues ad-hoc (data) questions – To empowering stakeholders in answering ad-hoc queries and reducing the time to analyse and steer the business