127 Tableau courses
Get a 10% discount on your first order when you use this promo code at checkout: MAY24BAN3X
Tableau Desktop - Part 1
By Nexus Human
Duration 2 Days 12 CPD hours Overview Identify and configure basic functions of Tableau. Connect to data sources, import data into Tableau, and save Tableau files Create views and customize data in visualizations. Manage, sort, and group data. Save and share data sources and workbooks. Filter data in views. Customize visualizations with annotations, highlights, and advanced features. Create and enhance dashboards in Tableau. Create and enhance stories in Tableau As technology progresses and becomes more interwoven with our businesses and lives, more and more data is collected about business and personal activities. This era of "big data" has exploded due to the rise of cloud computing, which provides an abundance of computational power and storage, allowing organizations of all sorts to capture and store data. Leveraging that data effectively can provide timely insights and competitive advantage. The creation of data-backed visualizations is a key way data scientists, or any professional, can explore, analyze, and report insights and trends from data. Tableau© software is designed for this purpose. Tableau was built to connect to a wide range of data sources and allows users to quickly create visualizations of connected data to gain insights, show trends, and create reports. Tableau's data connection capabilities and visualization features go far beyond those that can be found in spreadsheets, allowing users to create compelling and interactive worksheets, dashboards, and stories that bring data to life and turn data into thoughtful action. Prerequisites To ensure your success in this course, you should have experience managing data with Microsoft© Excel© or Google Sheets?. LESSON 1: TABLEAU FUNDAMENTALS * Topic A: Overview of Tableau * Topic B: Navigate and Configure Tableau LESSON 2: CONNECTING TO AND PREPARING DATA * Topic A: Connect to Data * Topic B: Build a Data Model * Topic C: Save Workbook Files * Topic D: Prepare Data for Analysis LESSON 3: EXPLORING DATA * Topic A: Create Views * Topic B: Customize Data in Visualizations LESSON 4: MANAGING, SORTING, AND GROUPING DATA * Topic A: Adjust Fields * Topic B: Sort Data * Topic C: Group Data LESSON 5: SAVING, PUBLISHING, AND SHARING DATA * Topic A: Save Data Sources * Topic B: Publish Data Sources and Visualizations * Topic C: Share Workbooks for Collaboration LESSON 6: FILTERING DATA * Topic A: Configure Worksheet Filters * Topic B: Apply Advanced Filter Options * Topic C: Create Interactive Filters LESSON 7: CUSTOMIZING VISUALIZATIONS * Topic A: Format and Annotate Views * Topic B: Emphasize Data in Visualizations * Topic C: Create Animated Workbooks * Topic D: Best Practices for Visual Design LESSON 8: CREATING DASHBOARDS IN TABLEAU * Topic A: Create Dashboards * Topic B: Enhance Dashboards with Actions * Topic C: Create Mobile Dashboards LESSON 9: CREATING STORIES IN TABLEAU * Topic A: Create Stories * Topic B: Enhance Stories with Tooltips

Tableau for Data-Driven Decision Makers
By Nexus Human
Duration 1 Days 6 CPD hours This course is intended for This course is designed for professionals in a variety of job roles who receive Tableau data visualizations from data analysts or from data visualization engineers. These data report recipients want to take advantage of the many Tableau features and capabilities that enable them to explore the data behind the initial analysis, perform additional analysis to ask next-level questions of the data, and to customize visualizations and dashboards to share new insights and create compelling reports. Overview Explore Tableau reports. Analyze data to get answers and insights. Sort and group data for analysis and reporting. Filter views. Prepare reports. Troubleshoot, collaborate, and share views and analysis As data acquisition, access, analysis, and reporting are interwoven with our businesses and lives, more and more data is collected about business and personal activities. This abundance of data and the computing power to analyze it has increased the use of data analysis and data visualization across a broad range of job roles. Decision makers of all types, including managers and executives, must interact with, interpret, and develop reports based on data and analysis provided to them. Tableau© software is designed for data analysis and the creation of visualizations. Data analysts prepare data, perform initial analysis, and create visualizations that are then passed on to business data-driven decision makers. These decision makers can use Tableau's tools to explore the data, perform further analysis to find new insights, make decisions, and create customized reports to share their findings. Prerequisites To ensure your success in this course, you should have experience managing data with Microsoft© Excel© or Google Sheets? LESSON 1: EXPLORING TABLEAU REPORTS * Topic A: Data Analysis Workflow with Tableau * Topic B: Explore Views * Topic C: Edit Workbooks LESSON 2: ANALYZING DATA TO GET ANSWERS AND INSIGHTS * Topic A: Configure Marks with the Marks Card * Topic B: Ask New Questions by Changing Aggregation * Topic C: Find Answers with Calculations * Topic D: Answer Questions with Table Calculations LESSON 3: SORTING AND GROUPING DATA FOR ANALYSIS AND REPORTING * Topic A: Sort Data * Topic B: Group Data LESSON 4: FILTERING VIEWS * Topic A: Filter Data to Refine Analysis * Topic B: Create Interactive Filters for Reports LESSON 5: PREPARING REPORTS * Topic A: Format and Annotate Views to Tell Your Story * Topic B: Emphasize Data in Reports * Topic C: Animate Visualizations for Clarity LESSON 6: TROUBLESHOOTING, SHARING, AND COLLABORATING * Topic A: Troubleshoot Data Issues * Topic B: Collaborate in Tableau Online * Topic C: Collaborate with Non-Tableau Users
Tableau Desktop - Part 2
By Nexus Human
Duration 2 Days 12 CPD hours This course is intended for This course is designed for professionals in a variety of job roles who are currently using Tableau to perform numerical or general data analysis, visualization, and reporting. They need to provide data visualizations from multiple data sources, or combine data to show comparisons, manipulate data through calculations, create interactive visualizations, or create visualizations that showcase insights from statistical analysis. This course is also designed for students who plan to obtain Tableau Desktop Certified Associate certification, which requires candidates to pass the Tableau Desktop Certified Associate exam. Overview Blend data multiple sources. Join data. Access data in PDFs. Refine visualizations with sets and parameters. Analyze data with calculations. Visualize data with advanced calculations. Perform statistical analysis and forecasting. Create geographic visualizations. Get answers with Ask and Explain The advent of cloud computing and storage has ushered in the era of "big data." With the abundance of computational power and storage, organizations and employees with many different roles and responsibilities can benefit from analyzing data to find timely insights and gain competitive advantage. Data-backed visualizations allow anyone to explore, analyze, and report insights and trends from data. Tableau© software is designed for this purpose. Tableau was built to connect to a wide range of data sources and allows users to quickly create visualizations of connected data to gain insights, show trends, and create reports. Beyond the fundamental capabilities of creating data driven visualizations, Tableau allows users to manipulate data with calculations to show insights, make visualizations interactive, and perform statistical analysis. This gives users the ability to create and share data driven insights with peers, executives, and clients. Prerequisites Tableau Desktop: Part 1 LESSON 1: BLENDING DATA FROM MULTIPLE SOURCES * Topic A: Blend Data * Topic B: Refine Blends to Visualize Key Information LESSON 2: JOINING DATA * Topic A: Create Joins * Topic B: Troubleshoot Joins * Topic C: Merge Data with Unions LESSON 3: ACCESSING DATA IN PDFS * Topic A: Connect to PDFs * Topic B: Clean Up and Organize PDF Data LESSON 4: REFINING VISUALIZATIONS WITH SETS AND PARAMETERS * Topic A: Create Sets * Topic B: Analyze Data with Sets * Topic C: Apply Parameters to Refine Visualizations * Topic D: Create Advanced Visualizations LESSON 5: ANALYZING DATA WITH CALCULATIONS * Topic A: Create Calculated Fields to Analyze Data * Topic B: Manipulate Data with Functions * Topic C: Analyze Data with Table Calculations LESSON 6: VISUALIZING DATA WITH ADVANCED CALCULATIONS * Topic A: Create Groups and Bins with Calculations * Topic B: Analyze Data with LOD Expressions LESSON 7: PERFORMING STATISTICAL ANALYSIS AND FORECASTING * Topic A: Perform Statistical Analysis * Topic B: Forecast Data Trends LESSON 8: CREATING GEOGRAPHIC VISUALIZATIONS * Topic A: Create Maps * Topic B: Customize Mapped Data LESSON 9: GETTING ANSWERS WITH ASK AND EXPLAIN * Topic A: Ask Data * Topic B: Explain Data ADDITIONAL COURSE DETAILS: Nexus Humans Tableau Desktop - Part 2 training program is a workshop that presents an invigorating mix of sessions, lessons, and masterclasses meticulously crafted to propel your learning expedition forward. This immersive bootcamp-style experience boasts interactive lectures, hands-on labs, and collaborative hackathons, all strategically designed to fortify fundamental concepts. Guided by seasoned coaches, each session offers priceless insights and practical skills crucial for honing your expertise. Whether you're stepping into the realm of professional skills or a seasoned professional, this comprehensive course ensures you're equipped with the knowledge and prowess necessary for success. While we feel this is the best course for the Tableau Desktop - Part 2 course and one of our Top 10 we encourage you to read the course outline to make sure it is the right content for you. Additionally, private sessions, closed classes or dedicated events are available both live online and at our training centres in Dublin and London, as well as at your offices anywhere in the UK, Ireland or across EMEA.
Learn Tableau and Ace the Tableau Certified Data Analyst Exam
By Packt
Do you want to learn Tableau and crack the Tableau Certified Data Analyst Exam? Then this course is for you! This course is designed for absolute beginners, and it is well equipped with detailed video tutorials, exam notes PDF, tips and tricks, and full practice tests in exam format along with solutions.

Learn Tableau and Ace the Tableau Desktop Specialist Exam
By Packt
This course is designed for absolute beginners and explains even the most basic concepts in Tableau from scratch. By completing this course, you will be able to create rich visualizations easily and confidently and have the knowledge required to crack the Tableau Desktop Specialist Exam.
Tableau Prep Builder for Beginners - Getting Started
By Packt
This course is designed for beginners who want to learn how to use Tableau Prep Builder for data preparation and data cleaning. We will start from scratch; no specific knowledge is required; you should only be familiar with Tableau.
Ultimate Tableau Desktop Course - Beginner to Advanced Bundle
By Packt
Let's build sophisticated visualizations and dashboards using Sankey diagrams and geospatial, sunburst, and circular charts and animate your visualizations. We will also cover advanced Tableau topics, such as Tableau parameters and use cases and Level of Detail (LOD) expressions, spatial functions, advanced filters, and table calculations.
Python, SQL, and Tableau: Integrating Python, SQL, and Tableau
By Packt
Learn how to combine the three most important tools in data science: Python, SQL, and Tableau
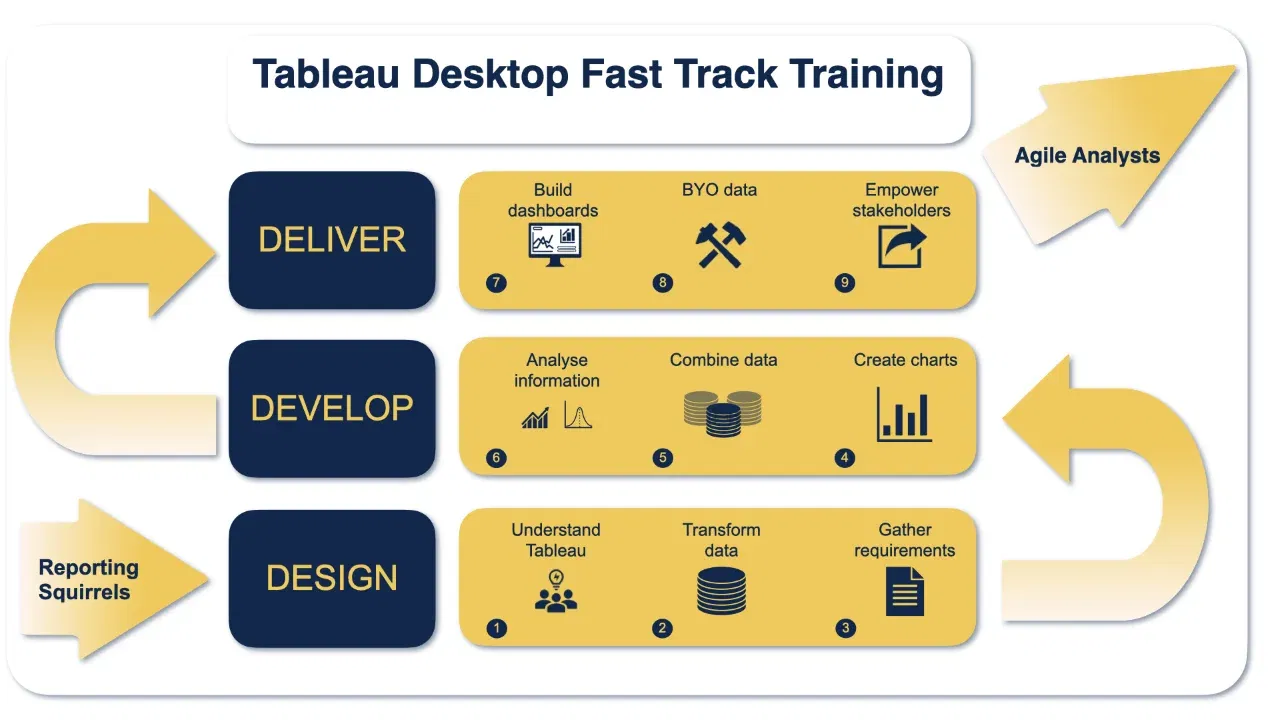
Tableau Training On Tap - Fast Track
By Tableau Training Uk
Tableau is an intuitive and simple tool to learn. This Tableau training course is a jumpstart to getting report writers and analysts who are self-taught or have no previous knowledge to being productive. It covers everything from connecting to data, through to creating interactive dashboards with a range of visualisations in three days. Having a quick turnaround from starting to use Tableau, to getting real, actionable insights means that you get a swift return on your investment. At the end of this course, you will be able to communicate insights more effectively, enabling your organisation to make better decisions, quickly. This accelerated approach is key to getting engagement from within your organisation so everyone can immediately see and feel the impact of the data and insights you create. Our Tableau Desktop Fast Track course combines all of our Foundation (Fundamentals) and Analyst (Intermediate) content into a 3 day live online course with added access to online bonus content of 3 additional modules. Gathering Requirements, Bring Your Own Data and Engaging Users. -------------------------------------------------------------------------------- WHAT DO YOU GET? This course is delivered live virtually and has all material provided through our online portal, together with email support and live coaching sessions. The full program includes all of the following elements: * 3 days of live and interactive instructor-led sessions delivered by an expert Tableau Trainer * 6 weeks access to our live coaching program delivered by expert Tableau coaches * 50+ practical exercises to practice what you learn * 12 months access to video’s that walk you through the theory and exercise solutions * Practical advice, tools and resources for using Tableau in the real world * The three additional online modules provide: * Clarity on the approach to gathering dashboard requirements in a way that can be translated into dashboard designs. * An agile and iterative development process that delivers products that meet user needs more quickly and effectively. * An understanding of how end users will interact with dashboards to ensure that designers deliver actionable results. THE SYLLABUS PHASE 1: DESIGN MODULE 1: UNDERSTAND TABLEAU * What is possible * How does Tableau deal with data * Know your way around * Review of Type Conversions * How do we format charts * Dashboard basics – My first Dashboard MODULE 2: TRANSFORM DATA * Connecting to and setting up data in Tableau * Modifying data attributes * How Do I Structure my Data – Groups & Hierarchies, Visual Groups * How Tableau Deals with Dates – Using Discrete and Continuous Dates, Custom Dates * How do I create calculated fields and why? – Creating Calculated Fields, Types of calculated fields, Row Level v Aggregations, Aggregating dimensions in calculations, Changing the Level of Detail (LOD) of calculations – What, Why, How MODULE 3: GATHER REQUIREMENTS(ONLINE CONTENT ONLY) * Brainstorm and assess possible priorities * Pitfalls to avoid * Gather requirements PHASE 2: DEVELOP MODULE 4: CREATE CHARTS * Charts that Compare Multiple Measures – Measure Names and Measure Values, Shared Axis Charts, Dual Axis Charts, Scatter Plots * Showing progress over time * Creating Tables – Creating Tables, Highlight Tables, Heat Maps * Showing Relational & Proportional Data – Pie Charts, Donut Charts, Tree Maps * Making things dynamic with parameters MODULE 5: COMBINE DATA * Relationships * Joining Tables – Join Types, Joining tables within the same database, cross database joins, join calculations * Blending – How to create a blend with common fields, Custom defined Field relationships and mismatched element names, Calculated fields in blended data sources * Unions – Manual Unions and mismatched columns, Wildcard unions * Data Extracts – Creating & Editing Data extracts MODULE 6: ANALYSE INFORMATION * Table Calculations * Sets, Reference Lines, Trends and Forecasting * Answering spatial questions – Mapping, Creating a choropleth (filled) map, Using your own images for spatial analysis, Mapping with spatial files * Advanced charts * Bar in Bar charts * Bullet graphs * Creating Bins and Histograms * Creating a Box & Whisker plot * Viz in Tooltips PHASE 3: DESIGN MODULE 7: BUILD DASHBOARDS * Using the Dashboard Interface * Device layouts * Dashboard Actions – Set actions, Parameter actions * Viz in Tooltips for Dashboards * Dashboard containers – Horizontal & Vertical containers, Hidden containers * Navigate between dashboards * Telling data driven stories MODULE 8: BRING YOUR OWN DATA * Design * Best Practices & Resources * Wireframe templates * Questions * Process * Start building and testing MODULE 9: EMPOWER STAKEHOLDERS * What is Tableau Server * Publishing & permissions * How can your users engage with content * The Tableau ecosystem * Review your progress * Your next steps -------------------------------------------------------------------------------- HOW MUCH OF YOUR TIME WILL THIS TAKE? Delegates are also provided 6 weeks access to our Tableau Coaching. We run Live Q&A sessions from 4pm-5pm on a Monday (Connecting to Data and Calculated Fields), 2pm-3pm Friday (Creating Charts) & 4pm-5pm Friday (Dashboard Design). The coaching helps delegates to transition from the theory of using Tableau to its practical use. We’d be expecting them to apply the exercises you’ll be doing during the course, onto your own data after the course. In our experience, this is the best way to increase both understanding and long term memory retention. The live coaching also acts as a troubleshooting platform for any practical issues that delegates need to overcome in the real world. Delegates also have 12 months access to all of the training material covered in the course in the form of an online portal (this includes theory videos, exercise solution videos, exercise materials and even quizzes). We have a growing LinkedIn community that delegates are encouraged to join and participate in. We regularly post useful blog posts and additional training that will enhance the Tableau journey and understanding. -------------------------------------------------------------------------------- We help teams using Tableau to transform in the following ways : * From a disjointed understanding of Tableau – To being familiar with Tableau terminology and capability * From ad-hoc data uploads and error prone calculations – To reusable data connections and robust metrics * From disjointed stakeholder questions – To clear and concise requirements that lead to decision making * From being unsure how difficult Tableau will be to learn – To being able to develop standard charts and tables in Tableau with dynamic reporting capabilities * From manually combining data for each analytical task – To dynamically combining data from multiple tables for analysis * From being unsure how to answer analytical questions and what options there are – To being equipped with multiple actionable, dynamic, analytical use cases * From not knowing Why, When and How to create Dashboards or Story’s – To being able to combine analysis to answer complex questions and tell data driven stories * From using demo data theory – To Delivering value [Answering questions] on their own data * From spending lots of time answering colleagues ad-hoc (data) questions – To empowering stakeholders in answering ad-hoc queries and reducing the time to analyse and steer the business