67 Data Analysis Expressions courses
Get a 10% discount on your first order when you use this promo code at checkout: MAY24BAN3X
Introduction to DAX for Power BI
By Nexus Human
Duration 2 Days 12 CPD hours This course is intended for This course is intended for business users who have been using Power BI to build analytic solutions and are ready to take advantage of the power and flexibility that DAX provides. Learning DAX is a very common 'next step' for experienced Power BI users. Overview At course completion, you should be able to describe DAX syntax, data types, and errors use DAX to create calculated columns, measures, and tables explain how DAX calculations are evaluated, along with the differences between row context and filter context configure and use Time Intelligence to perform common time-based calculations, for example to-date calculations, year-over-year analysis, moving averages, etc. create calculated columns and measures that use data from multiple tables in the data model write measures that handle error conditions gracefully use DAX to enhance the Power BI user experience use DAX Studio to connect to a Power BI data model and execute simple queries Welcome to Introduction to DAX for Power BI. This two-day instructor-led course is intended for business users who have been using Power BI and want to use DAX to create custom calculations in their data models. In this class, you will be introduced to using Data Analysis Expressions (DAX), which is the expression language that is used to create custom calculations in the Power BI Data model. The course covers some of the theoretical underpinnings of the data model and the DAX language, but the emphasis is on using DAX to solve common business problems. You will learn how to write your own calculated columns, measures, and tables, how to visualize the way Power BI computes DAX calculations, and how to troubleshoot custom code. MODULE 1: GETTING STARTED WITH DAX * INTRODUCTION TODAX * CREATING OBJECTS WITHDAX * CONTEXT AND RULES OF EVALUATION * VARIABLES,COMMENTS,AND TESTING MODULE 2: PERFORMING BASIC CALCULATIONS * GETTING STARTED * IMPLICIT MEASURES * ADDING QUICK MEASURES * WORKING WITH DAX DATA TYPES . * DOING BASIC MATH * USING LOGIC IN YOUR CALCULATIONS * USING THE IF() FUNCTION * NESTED IF() * USING THE SWITCH() FUNCTION * ADVANCED SWITCH() * LOGICAL OPERATORS & FUNCTIONS: ||, OR(), &&, AND(), NOT() * AGGREGATING AND SUMMARIZING DATA * THE SUM() FUNCTION MODULE 3: WORKING WITH CONTEXT IN THE DATA MODEL * CONTEXT DEFINED * DATA MODELING BASICS * INTRODUCTION TO DIMENSIONAL MODELING * RELATIONSHIPS AND THEIR EFFECT ON THE EVALUATION CONTEXT * GETTING DATA FROM OTHER TABLES USING RELATED() AND RELATEDTABLE * LOOKING UP DATA WITHOUT USING RELATIONSHIPS * MODIFYING THE CONTEXT USING CALCULATE() MODULE 4: PERFORMING MORE ADVANCED CALCULATIONS * THE DAX ITERATOR FUNCTIONS * USING TABLE MANIPULATION FUNCTIONS MODULE 5: WORKING WITH TIME * PERFORMING DATE CALCULATIONS * WORKING WITH DATE TABLES * GENERATING A DATE TABLE WITH THE CALENDAR() FUNCTION * DEFINING CUSTOM OPERATING PERIODS * YTD, QTD, AND MTD CALCULATIONS * CUSTOM TO-DATE CALCULATIONS * FINDING YEAR-OVER-YEAR CHANGE * FINDING MOVING AVERAGES MODULE 6: ENHANCING THE USER EXPERIENCE * CONTROLLING VISIBILITYOF YOUR MEASURES * USING WHAT-IF PARAMETERS * ADDING BANDING * USING DAX TO PROVIDE ROW-LEVEL SECURITY

Mastering the Power BI Key Fundamentals
By Packt
This course teaches the fundamental concepts of DAX in Power BI. If you have the questions: How do I learn DAX? What is the best way to learn DAX fast?-then this is the best course for you. This course teaches fundamental concepts and does not cover visualization or various advanced DAX patterns for specific questions.

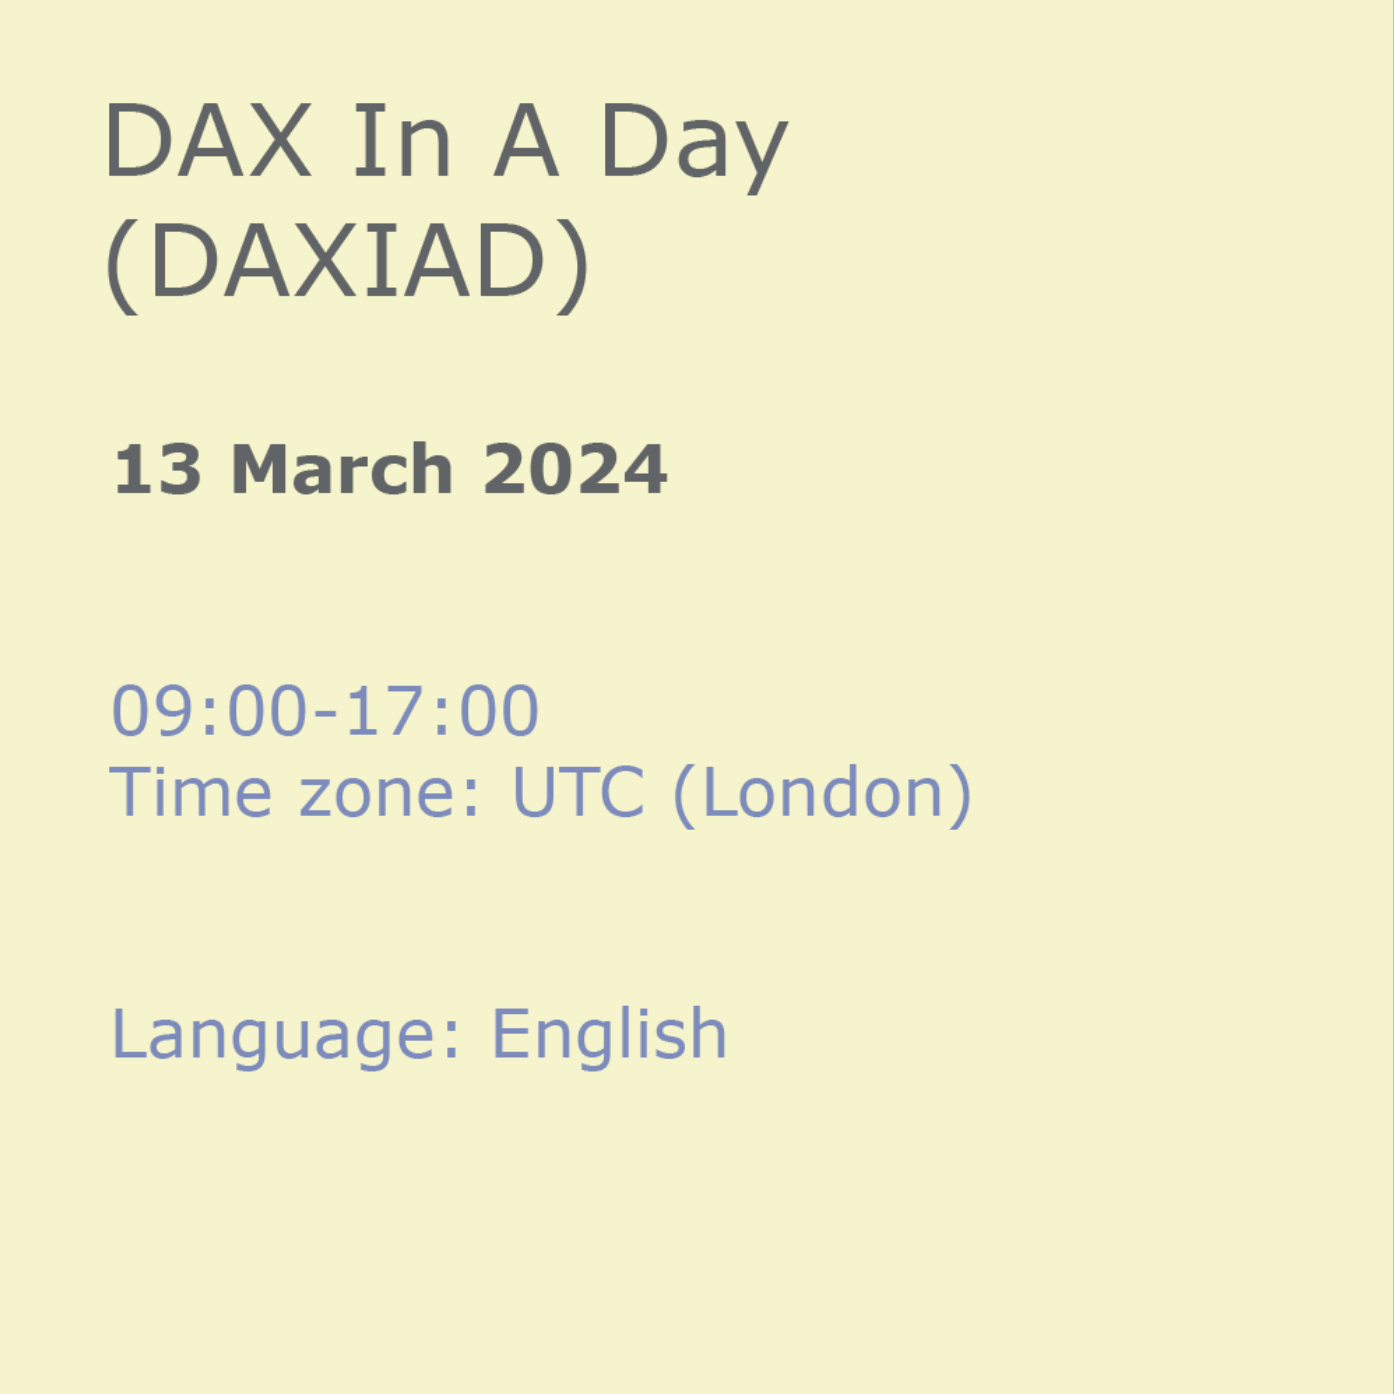
DAX In A Day (DAXIAD)
By Online Productivity Training
OVERVIEW Prerequisites—DIAD training and Advanced Data Modeling and Shaping training or equivalent working experience This course has been designed specifically for experienced model developers and gives a more advanced treatment of DAX formulas than either DIAD or the PL-300 course. We recommend that attendees have prior experience working with Power BI Desktop to create data models. During this course you will review: * Writing DAX formulas. * Defining calculated tables and columns. * Defining measures. * Using DAX iterator functions. * Modifying filter context. * Using DAX time intelligence functions. After completing this training, the attendees should be able to work with Data Analysis Expressions (DAX), perform calculations and define common business calculations for use in reports, address performance and functionality concerns. COURSE BENEFITS: * Understand Analytic queries in Power BI * Create calculated tables, calculated columns and measures * Use DAX functions and operators to build DAX formulas * Use DAX iterator functions * Create formulas that manipulate the filter context * Use DAX time intelligence functions WHO IS THE COURSE FOR? * Analysts with experience of Power BI wishing to develop more advanced formulas in DAX * Power BI developers who wish to deepen their understanding of the process of calculating formulas so as to make development faster and more reliable LAB OUTLINE Lab 1 Setup * Connect to data and understand the objectives of the future labs Lab 2 Write DAX Formulas For Power BI * Create a measure * Use variables in the measure definition Lab 3 Add Calculated Table And Columns * Duplicate a table * Create a hierarchy * Create a date table * Add calculated columns Lab 4 Add Measures To Power BI Desktop Models * Add an implicit measure to a report * Add an explicit measure * Add a compound measure * Add a quick measure Lab 5 Use DAX Iterator Functions In A Power BI Desktop Model * Complex summarization * Higher grain summarization * Create ranking measure Lab 6 Modify DAX Filter Context In Power BI Desktop Models * Apply Boolean expression filter * Remove filters: use ALL * Remove filters: use AllSelected * Preserve filters: use KeepFilters * HASONEVALUE * ISINSCOPE * Context transition Lab 7 Use DAX Time Intelligence Functions In Power BI Desktop Models * TOTALYTD * SAMEPERIODLASTYEAR * Calculate new occurrences * Snapshot calculations
Data Analysis in Excel Level 3 Course
By Apex Learning
COURSE OVERVIEW: Data analysis is a hot skill in today's job market. According to a recent study by LinkedIn, demand for data analysts is growing 15 times faster than the average for all occupations. And the salaries are good too. The average salary for a data analyst in the UK is £40,000. If you're looking to get ahead in your career or learn a new skill that's in high demand, then the Data Analysis in Excel Level 3 Course is for you. In this course, you'll learn how to use Excel to analyse data like a pro. You'll learn how to clean, format, and analyse data using various Excel tools and techniques. You'll also learn how to create charts and graphs to visualise your data. This course won't merely make you adept at Excel. It will mould you into a data wizard, wielding Excel as a potent tool to make data sing and secrets reveal themselves. Enrol Today and Start Learning! -------------------------------------------------------------------------------- KEY FEATURES OF THE COURSE: Embark on your data analysis journey with us and discover these exciting features: * A CPD Certificate to validate your newfound skills. * 24/7 Learning Assistance for any hour inspiration strikes. * Engaging learning materials to ensure an enriching learning experience. -------------------------------------------------------------------------------- WHO IS THIS COURSE FOR? Our Data Analysis in Excel Level 3 Course caters to ambitious individuals with a basic understanding of Excel, eager to take their skills to new heights. This course welcomes everything from budding data enthusiasts to established business analysts seeking to fortify their analytical toolkits. -------------------------------------------------------------------------------- WHAT YOU WILL LEARN: Dive deep into the labyrinth of data as you master essential modules such as 'Search for and Replace Data,' 'Sort and Filter Data,' and 'Query Data with Database Functions.' Venture further into data exploration with our 'Outline and Subtotal Data' module, where you'll learn to summarise your data for a more organised view efficiently. The journey continues with modules like 'Create Charts' and 'Modify and Format Charts,' enabling you to translate complex data into easy-to-understand visuals. Furthermore, our dedicated modules on 'Creating a PivotTable' and 'Analysing PivotTable Data' promise a comprehensive understanding of one of Excel's most powerful tools. -------------------------------------------------------------------------------- WHY ENROL IN THIS COURSE: Rated as a top-reviewed course and constantly updated to keep up with the latest trends, our Data Analysis in Excel Level 3 Course equips you with sought-after skills like data forecasting, creating sparklines, using advanced chart features, and more. -------------------------------------------------------------------------------- REQUIREMENTS: While no specific prerequisites are required, a basic understanding of Excel and an eagerness to explore the fascinating world of data analysis would be beneficial. -------------------------------------------------------------------------------- CAREER PATH: On completion of this Data Analysis in Excel Level 3 Course course, you'll be ready to step into diverse roles such as: * Data Analyst (£30,000-£35,000) * Business Intelligence Analyst (£32,000-£37,000) * Market Research Analyst (£28,000-£33,000) * Operations Analyst (£31,000-£36,000) * Financial Analyst (£35,000-£40,000) * Supply Chain Analyst (£30,000-£35,000) * Sales Analyst (£29,000-£34,000) -------------------------------------------------------------------------------- CERTIFICATION: Upon successful completion of the course, you'll be awarded a prestigious CPD Certificate, demonstrating your expertise in data analysis using Excel. So, are you ready to discover the hidden stories in data and revolutionise decision-making? Enrol in our Data Analysis in Excel Level 3 Course and start your journey today! -------------------------------------------------------------------------------- COURSE CURRICULUM 11 sections • 32 lectures • 04:43:00 total length •Insert, Delete, and Adjust Cells, Columns, and Rows: 00:10:00 •Search for and Replace Data: 00:09:00 •Use Proofing and Research Tools: 00:07:00 •Sort Data: 00:10:00 •Filter Data: 00:10:00 •Query Data with Database Functions: 00:09:00 •Outline and Subtotal Data: 00:09:00 •Apply Intermediate Conditional Formatting: 00:07:00 •Apply Advanced Conditional Formatting: 00:05:00 •Create Charts: 00:13:00 •Modify and Format Charts: 00:12:00 •Use Advanced Chart Features: 00:12:00 •Create a PivotTable: 00:13:00 •Analyze PivotTable Data: 00:12:00 •Present Data with PivotCharts: 00:07:00 •Filter Data by Using Timelines and Slicers: 00:11:00 •Use Links and External References: 00:12:00 •Use 3-D References: 00:06:00 •Consolidate Data: 00:05:00 •Use Lookup Functions: 00:12:00 •Trace Cells: 00:09:00 •Watch and Evaluate Formulas: 00:08:00 •Apply Data Validation: 00:13:00 •Search for Invalid Data and Formulas with Errors: 00:04:00 •Work with Macros: 00:18:00 •Create Sparklines: 00:07:00 •MapData: 00:07:00 •Determine Potential Outcomes Using Data Tables: 00:08:00 •Determine Potential Outcomes Using Scenarios: 00:09:00 •Use the Goal Seek Feature: 00:04:00 •Forecasting Data Trends: 00:05:00 •Assignment - Data Analysis in Excel Level 3 Course: 00:00:00

Power BI Masterclass
By Packt
An intermediate-level course that will help you improve your Power BI skills and become an expert data analyst or data scientist. The course is carefully structured to provide an in-depth understanding of Microsoft Power BI and its features, along with some important tips and tricks.
Power BI Masterclass 2023
By Packt
This comprehensive course delves deep into Power BI, guiding you through essential skills such as interactive reporting, DAX calculations, and advanced data modelling. From enabling interactive features to crafting insightful reports, gain the expertise needed to harness Power BI's full potential and excel in data analysis and visualization.
Data Analysts' Toolbox - Excel, Python, Power BI, Alteryx, Qlik Sense, R, Tableau
By Packt
This course explains how huge chunks of data can be analyzed and visualized using the power of the data analyst toolbox. You will learn Python programming, advanced pivot tables' concepts, the magic of Power BI, perform analysis with Alteryx, master Qlik Sense, R Programming using R and R Studio, and create stunning visualizations in Tableau Desktop.
The PowerBI Formulas course delves into the intricacies of Power Query and Power Pivot in Power BI, focusing on various techniques to enhance data analysis and visualization. Through a series of modules, participants will learn how to effectively use Power Query and Power Pivot to transform, manipulate, and model data for creating insightful reports and dashboards. LEARNING OUTCOMES: 1. Master the fundamentals of Power Query and Power Pivot in Power BI. 2. Understand data transformation techniques using Power Query. 3. Explore advanced data modeling with Power Pivot. 4. Learn to create calculated columns and measures. 5. Gain proficiency in using DAX (Data Analysis Expressions) formulas. 6. Apply Power Query and Power Pivot to real-world data scenarios. 7. Utilize data relationships and hierarchies for effective data modeling. 8. Create dynamic visualizations and reports using the transformed data. WHY BUY THIS POWERBI FORMULAS? 1. Unlimited access to the course for forever 2. Digital Certificate, Transcript, student ID all included in the price 3. Absolutely no hidden fees 4. Directly receive CPD accredited qualifications after course completion 5. Receive one to one assistance on every weekday from professionals 6. Immediately receive the PDF certificate after passing 7. Receive the original copies of your certificate and transcript on the next working day 8. Easily learn the skills and knowledge from the comfort of your home CERTIFICATION After studying the course materials of the PowerBI Formulas there will be a written assignment test which you can take either during or at the end of the course. After successfully passing the test you will be able to claim the pdf certificate for £5.99. Original Hard Copy certificates need to be ordered at an additional cost of £9.60. WHO IS THIS COURSE FOR? * Business analysts and data analysts seeking to enhance their Power BI skills. * Data professionals looking to leverage Power Query and Power Pivot for data analysis. * Professionals working with data visualization and reporting. * Individuals interested in learning advanced data transformation and modeling techniques. PREREQUISITES This PowerBI Formulas does not require you to have any prior qualifications or experience. You can just enrol and start learning.This PowerBI Formulas was made by professionals and it is compatible with all PC's, Mac's, tablets and smartphones. You will be able to access the course from anywhere at any time as long as you have a good enough internet connection. CAREER PATH * Data Analyst: Analyze and visualize data to extract meaningful insights. * Business Intelligence Analyst: Transform raw data into actionable business insights. * Data Scientist: Apply data manipulation and modeling techniques for predictions. * Reporting Specialist: Create engaging and informative reports and dashboards. * Business Analyst: Use data-driven insights to inform decision-making processes. COURSE CURRICULUM PowerBI Formulas power pivot power query - 1 00:01:00 power pivot power query - 2 00:02:00 power pivot power query - 3 00:06:00 power pivot power query - 4 00:07:00 power pivot power query - 5 00:02:00 power pivot power query - 6 00:05:00 power pivot power query - 7 00:05:00 power pivot power query - 8 00:04:00 power pivot power query - 9 00:03:00 power pivot power query - 10 00:02:00 power pivot power query - 11 00:04:00 power pivot power query - 12 00:08:00 power pivot power query - 13 00:04:00 power pivot power query - 14 00:03:00 power pivot power query - 15 00:13:00 power pivot power query - 16 00:03:00 power pivot power query - 17 00:13:00 Assignment Assignment - PowerBI Formulas 00:00:00