- Professional Development
- Medicine & Nursing
- Arts & Crafts
- Health & Wellbeing
- Personal Development

The Complete Tableau Bootcamp for Aspiring Data Scientists
By Packt
Learn the basics and the advanced concepts of Tableau to create stunning and detailed visualizations. This course provides step-by-step guidance on how we can make data easier to understand and easier to interpret by using visualizations. We'll be working with Tableau 2020.3.
Python for Data Visualization - A Beginner's Guide
By Packt
This beginner-friendly course takes us on a journey into data visualization. You will learn to transform raw data into stunning visuals using Matplotlib, Seaborn, and Plotly. From charts to dynamic heatmaps, we will master the essentials. Fuel your curiosity, enhance your skills, and communicate insights effectively to become a Python data visualization pro!
#BusComm Wednesday Breakfast Networking Meeting
By The Business Community
Are you an ambitious, entrepreneurial business owner with a collaborative mindset? You are? Good! You're in the right place. Running your own business can be tough and the odds are against you - but don't worry! The support you need is on your doorstep - at next to no cost!


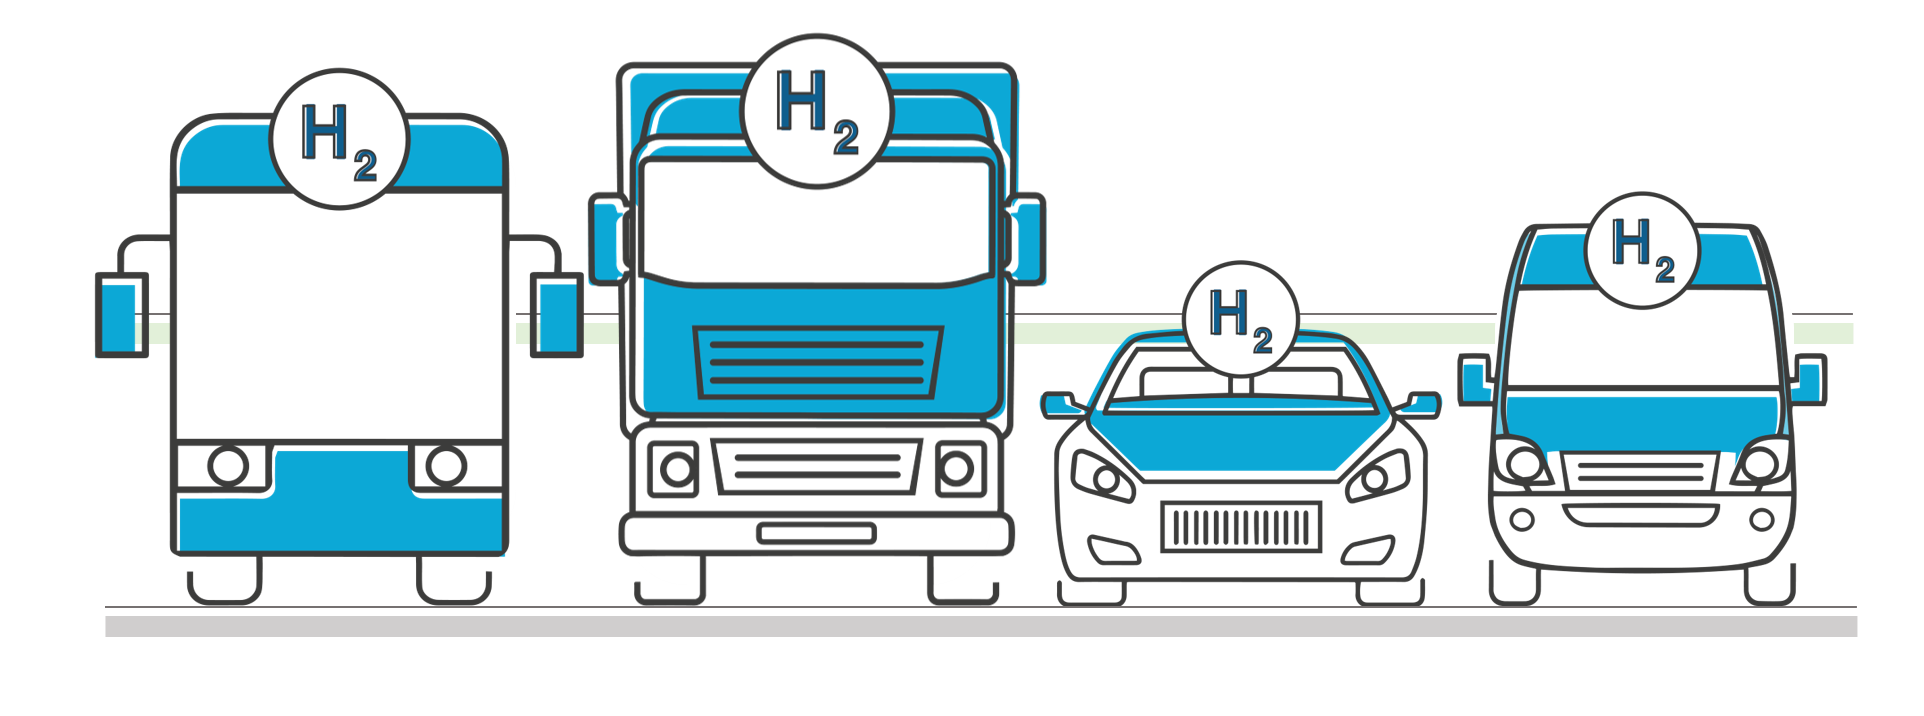
Hydrogen for Road Transport
By Cenex (Centre of Excellence for Low Carbon & Fuel Cell Technologies)
Join us for a micro-learning course in hydrogen for transport and learn about this potentially game-changing technology which brings the world a step closer to achieving net-zero emissions. Part of our Net Zero Transport Fundamentals Collection, where we look to provide bite-sized training on all the core technologies and topics relating to decarbonising the transport industry.


Sales Development Representative Analyst Diploma - CPD Certified
(12)By Academy for Health and Fitness