46 Business Intelligence (BI) courses delivered Live Online
Get a 10% discount on your first order when you use this promo code at checkout: MAY24BAN3X
Microsoft Power BI: Data Analysis Practitioner (Second Edition) (v1.3)
By Nexus Human
Duration 2 Days 12 CPD hours This course is intended for This course is designed for professionals in a variety of job roles who are currently using desktop or web-based data management tools such as Microsoft Excel or SQL Server reporting services to perform numerical or general data analysis. They are responsible for connecting to cloud-based data sources, as well as shaping and combining data for the purpose of analysis. They are also looking for alternative ways to analyze business data, visualize insights, and share those insights with peers across the enterprise. This includes capturing and reporting on data to peers, executives, and clients. Overview In this course, you will analyze data with Microsoft Power BI. You will: Analyze data with self-service BI. Connect to data sources. Perform data cleaning, profiling, and shaping. Visualize data with Power BI. Enhance data analysis by adding and customizing visual elements. Model data with calculations. Create interactive visualizations. As technology progresses and becomes more interwoven with our businesses and lives, more data is collected about business and personal activities. This era of 'big data' is a direct result of the popularity and growth of cloud computing, which provides an abundance of computational power and storage, allowing organizations of all sorts to capture and store data. Leveraging that data effectively can provide timely insights and competitive advantages. Creating data-backed visualizations is key for data scientists, or any professional, to explore, analyze, and report insights and trends from data. Microsoft© Power BI© software is designed for this purpose. Power BI was built to connect to a wide range of data sources, and it enables users to quickly create visualizations of connected data to gain insights, show trends, and create reports. Power BI's data connection capabilities and visualization features go far beyond those that can be found in spreadsheets, enabling users to create compelling and interactive worksheets, dashboards, and stories that bring data to life and turn data into thoughtful action. ANALYZING DATA WITH SELF-SERVICE BI * Topic A: Data Analysis and Visualization for Business Intelligence * Topic B: Self-Service BI with Microsoft Power BI CONNECTING TO DATA SOURCES * Topic A: Create Data Connections * Topic B: Configure and Manage Data Relationships * Topic C: Save Files in Power BI PERFORMING DATA CLEANING, PROFILING, AND SHAPING * Topic A: Clean, Transform, and Load Data with the Query Editor * Topic B: Profile Data with the Query Editor * Topic C: Shape Data with the Query Editor * Topic D: Combine and Manage Data Rows VISUALIZING DATA WITH POWER BI * Topic A: Create Visualizations in Power BI * Topic B: Chart Data in Power BI ENHANCING DATA ANALYSIS * Topic A: Customize Visuals and Pages * Topic B: Incorporate Tooltips MODELING DATA WITH CALCULATIONS * Topic A: Create Calculations with Data Analysis Expressions (DAX) * Topic B: Create Calculated Measures and Conditional Columns CREATING INTERACTIVE VISUALIZATIONS * Topic A: Create and Manage Data Hierarchies * Topic B: Filter and Slice Reports * Topic C: Create Dashboards ADDITIONAL COURSE DETAILS: Nexus Humans Microsoft Power BI: Data Analysis Practitioner (Second Edition) (v1.3) training program is a workshop that presents an invigorating mix of sessions, lessons, and masterclasses meticulously crafted to propel your learning expedition forward. This immersive bootcamp-style experience boasts interactive lectures, hands-on labs, and collaborative hackathons, all strategically designed to fortify fundamental concepts. Guided by seasoned coaches, each session offers priceless insights and practical skills crucial for honing your expertise. Whether you're stepping into the realm of professional skills or a seasoned professional, this comprehensive course ensures you're equipped with the knowledge and prowess necessary for success. While we feel this is the best course for the Microsoft Power BI: Data Analysis Practitioner (Second Edition) (v1.3) course and one of our Top 10 we encourage you to read the course outline to make sure it is the right content for you. Additionally, private sessions, closed classes or dedicated events are available both live online and at our training centres in Dublin and London, as well as at your offices anywhere in the UK, Ireland or across EMEA.

Microsoft Power BI: Data Analysis Professional (Second Edition) (v1.3)
By Nexus Human
Duration 3 Days 18 CPD hours This course is intended for This course is designed for professionals in a variety of job roles who are currently using desktop or web-based data management tools such as Microsoft Excel or SQL Server reporting services to perform numerical or general data analysis. They are responsible for connecting to cloud-based data sources, as well as shaping and combining data for the purpose of analysis. They are also looking for alternative ways to analyze business data, visualize insights, and share those insights with peers across the enterprise. This includes capturing and reporting on data to peers, executives, and clients. This course is also designed for professionals who want to pursue the Microsoft Power BI Data Analyst (Exam PL-300) certification. Overview In this course, you will analyze data with Microsoft Power BI. You will: Analyze data with self-service BI. Connect to data sources. Perform data cleaning, profiling, and shaping. Visualize data with Power BI. Enhance data analysis by adding and customizing visual elements. Model data with calculations. Create interactive visualizations. Use advanced analysis techniques. Enhance reports and dashboards. Publish and share reports and dashboards. Extend Power BI beyond the desktop. As technology progresses and becomes more interwoven with our businesses and lives, more data is collected about business and personal activities. This era of 'big data' is a direct result of the popularity and growth of cloud computing, which provides an abundance of computational power and storage, allowing organizations of all sorts to capture and store data. Leveraging that data effectively can provide timely insights and competitive advantages. Creating data-backed visualizations is key for data scientists, or any professional, to explore, analyze, and report insights and trends from data. Microsoft© Power BI© software is designed for this purpose. Power BI was built to connect to a wide range of data sources, and it enables users to quickly create visualizations of connected data to gain insights, show trends, and create reports. Power BI's data connection capabilities and visualization features go far beyond those that can be found in spreadsheets, enabling users to create compelling and interactive worksheets, dashboards, and stories that bring data to life and turn data into thoughtful action. ANALYZING DATA WITH SELF-SERVICE BI * Topic A: Data Analysis and Visualization for Business Intelligence * Topic B: Self-Service BI with Microsoft Power BI CONNECTING TO DATA SOURCES * Topic A: Create Data Connections * Topic B: Configure and Manage Data Relationships * Topic C: Save Files in Power BI PERFORMING DATA CLEANING, PROFILING, AND SHAPING * Topic A: Clean, Transform, and Load Data with the Query Editor * Topic B: Profile Data with the Query Editor * Topic C: Shape Data with the Query Editor * Topic D: Combine and Manage Data Rows VISUALIZING DATA WITH POWER BI * Topic A: Create Visualizations in Power BI * Topic B: Chart Data in Power BI ENHANCING DATA ANALYSIS * Topic A: Customize Visuals and Pages * Topic B: Incorporate Tooltips MODELING DATA WITH CALCULATIONS * Topic A: Create Calculations with Data Analysis Expressions (DAX) * Topic B: Create Calculated Measures and Conditional Columns CREATING INTERACTIVE VISUALIZATIONS * Topic A: Create and Manage Data Hierarchies * Topic B: Filter and Slice Reports * Topic C: Create Dashboards USING ADVANCED ANALYSIS TECHNIQUES * Topic A: Create Calculated Tables, Variables, and Parameters * Topic B: Enhance Visuals with Statistical Analysis * Topic C: Perform Advanced Analysis ENHANCING REPORTS AND DASHBOARDS * Topic A: Enhance Reports * Topic B: Enhance Dashboards PUBLISHING AND SHARING REPORTS AND DASHBOARDS * Topic A: Publish Reports * Topic B: Create and Manage Workspaces * Topic C: Share Reports and Dashboards EXTENDING POWER BI BEYOND THE DESKTOP * Topic A: Use Power BI Mobile * Topic B: Extend Access with the Power BI API ADDITIONAL COURSE DETAILS: Nexus Humans Microsoft Power BI: Data Analysis Professional (Second Edition) (v1.3) training program is a workshop that presents an invigorating mix of sessions, lessons, and masterclasses meticulously crafted to propel your learning expedition forward. This immersive bootcamp-style experience boasts interactive lectures, hands-on labs, and collaborative hackathons, all strategically designed to fortify fundamental concepts. Guided by seasoned coaches, each session offers priceless insights and practical skills crucial for honing your expertise. Whether you're stepping into the realm of professional skills or a seasoned professional, this comprehensive course ensures you're equipped with the knowledge and prowess necessary for success. While we feel this is the best course for the Microsoft Power BI: Data Analysis Professional (Second Edition) (v1.3) course and one of our Top 10 we encourage you to read the course outline to make sure it is the right content for you. Additionally, private sessions, closed classes or dedicated events are available both live online and at our training centres in Dublin and London, as well as at your offices anywhere in the UK, Ireland or across EMEA.
U5TR712 - IBM Maximo Asset Management - System Administration and Development v7.6x
By Nexus Human
Duration 5 Days 30 CPD hours This course is intended for The audience includes implementers, developers, system administrators, project teams, database administrators and engine project technical teams. The audience also includes consultants that are looking to gain an understanding of Maximo Asset Management 7.6.0.x and the engine. Overview After completing this course, you should be able to perform the following tasks: List the components of Tivoli's process automation engine Understand Maximo modules and applications Understand Tivoli's Process Automation Engine Create the foundation data necessary for Maximo Asset Management Customize the engine database and applications Automate IBM Service Management applications using workflows Use the Maximo Work Centers Use the Integration Framework to import and export data This course is designed for anyone planning to use Maximo Asset Management and Tivoli?s process automation engine with one of the IBM System Management (ISM) products. It is a course that introduces you to the features and functions of both products. IBM MAXIMO ASSET MANAGEMENT OVERVIEW * This unit focuses on Maximo as an overall product and how Maximo assists companies with their asset management lifecycle. TIVOLI PROCESS AUTOMATION ENGINE * This unit describes the functions of Tivoli?s process automation engine and introduces the products that are based on the engine. This unit also introduces Start Centers and basic navigation. ARCHITECTURE AND COMPONENTS * This unit covers the architecture of Tivoli?s process automation engine. The various components that make up the system are described. The unit will address Java EE servers and the basic use of WebSphere© as it relates to the engine. The unit then covers the organization of the administrative workstation and system properties. The unit briefly describes the setup of the system for using attachments. FOUNDATION DATA * This unit covers the creation of foundation data for Tivoli?s process automation engine. The foundation data is the software constructs that are necessary in the basic configuration of the product. These constructs include organizations, sites, locations, classifications, and various engine financial configurations. SECURITY * Security addresses the need to protect system resources from unauthorized access by unauthenticated users. Resources in the system are protected by Authentication and Authorization. DATABASE ARCHITECTURE * This unit illustrates the possible database configurations using the Database Configuration application. It also presents specific command lines that you can run to configure the changes made on the attributes of business objects using the Database Configuration application. WORK MANAGEMENT * Work Management is a collection of components and products that work together to form a powerful process and work management system. This unit provides a look at work management and focuses on using Work Management to generate, process, and complete work orders. CUSTOMIZING AN APPLICATION * This unit provides an overview of the Application Designer and Migration Manager. You will learn how to change, duplicate and create applications. You will learn the process to move from development, integration testing, user acceptance testing and moving to production. AUTOMATION * This unit provides a high-level overview of key automation application programs and their functionality. It describes cron tasks, which are used to automate jobs in the system. The unit then discusses various communication tools in the system such as Communication Templates and the E mail Listener application. Finally, automated means of notification using escalations and actions are covered. WORKFLOW * This unit focuses on workflow. You learn about the Workflow Designer and its tools. You also learn how to modify an existing workflow and how to manage the included workflows. REPORTING * This unit provides an overview of the data analysis and reporting options that you can use in the system to analyze data. You create query by example (QBE) reports, result sets, key performance indicators (KPI), and query-based reports (QBRs). Students can optionally review Appendix A to learn how to create a simple enterprise report using Business Intelligence Reporting Tools (BIRT) designer. This report provides an example of how developers create more complex, widely used reports for users. * INTEGRATION FRAMEWORK * In this unit, a high-level overview of the Integration Framework is provided. The Integration Framework architecture and components are described and basic configuration steps are described. The configuration and steps for loading and exporting data to and from the system are covered. You have the opportunity to practice them also. * BUDGET MONITORING * This unit provides information on a new feature introduced in Maximo 7.6.0.8, the Budget Monitoring application. In this application, you can create budget records to monitor transactions in a financial period. INSPECTION TOOLS AND TASKS * This unit introduces the new Inspection application. You can use the Inspections tools to create online inspection forms by using your desktop computer or laptop, and you can use the forms to complete an inspection by using your desktop computer, laptop, or tablet. TROUBLESHOOTING * This unit focuses on troubleshooting as a systematic approach to solving a problem. The goal is to determine why something does not work as expected and to resolve the problem. It discusses the configuration of logging in the application. It also covers basic troubleshooting techniques, some important component logs, and information about obtaining help from Tivoli Support. ADDITIONAL COURSE DETAILS: Nexus Humans U5TR712 - IBM Maximo Asset Management - System Administration and Development v7.6x training program is a workshop that presents an invigorating mix of sessions, lessons, and masterclasses meticulously crafted to propel your learning expedition forward. This immersive bootcamp-style experience boasts interactive lectures, hands-on labs, and collaborative hackathons, all strategically designed to fortify fundamental concepts. Guided by seasoned coaches, each session offers priceless insights and practical skills crucial for honing your expertise. Whether you're stepping into the realm of professional skills or a seasoned professional, this comprehensive course ensures you're equipped with the knowledge and prowess necessary for success. While we feel this is the best course for the U5TR712 - IBM Maximo Asset Management - System Administration and Development v7.6x course and one of our Top 10 we encourage you to read the course outline to make sure it is the right content for you. Additionally, private sessions, closed classes or dedicated events are available both live online and at our training centres in Dublin and London, as well as at your offices anywhere in the UK, Ireland or across EMEA.
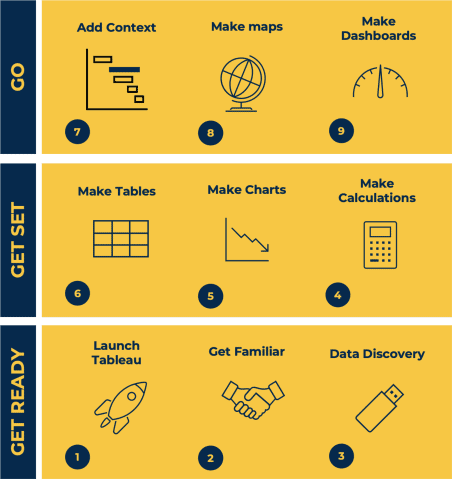
Tableau Desktop Training - Foundation
By Tableau Training Uk
This Tableau Desktop Training course is a jumpstart to getting report writers and analysts with little or no previous knowledge to being productive. It covers everything from connecting to data, through to creating interactive dashboards with a range of visualisations in two days of your time. -------------------------------------------------------------------------------- For Private options, online or in-person, please send us details of your requirements: -------------------------------------------------------------------------------- This Tableau Desktop Training course is a jumpstart to getting report writers and analysts with little or no previous knowledge to being productive. It covers everything from connecting to data, through to creating interactive dashboards with a range of visualisations in two days of your time. Having a quick turnaround from starting to use Tableau, to getting real, actionable insights means that you get a swift return on your investment of time and money. This accelerated approach is key to getting engagement from within your organisation so everyone can immediately see and feel the impact of the data and insights you create. This course is aimed at someone who has not used Tableau in earnest and may be in a functional role, eg. in sales, marketing, finance, operations, business intelligence etc. -------------------------------------------------------------------------------- THE COURSE IS SPLIT INTO 3 PHASES AND 9 MODULES: PHASE 1: GET READY MODULE 1: LAUNCH TABLEAU * Check Install & Setup * Why is Visual Analytics Important MODULE 2: GET FAMILIAR * What is possible * How does Tableau deal with data * Know your way around * How do we format charts * Dashboard Basics – My First Dashboard MODULE 3: DATA DISCOVERY * Connecting to and setting up data in Tableau * How Do I Explore my Data – Filters & Sorting * How Do I Structure my Data – Groups & Hierarchies, Visual Groups * How Tableau Deals with Dates – Using Discrete and Continuous Dates, Custom Dates PHASE 2: GET SET MODULE 4: MAKE CALCULATIONS * How Do I Create Calculated Fields & Why MODULE 5: MAKE CHARTS * Charts that Compare Multiple Measures – Measure Names and Measure Values, Shared Axis Charts, Dual Axis Charts, Scatter Plots * Showing Relational & Proportional Data – Pie Charts, Donut Charts, Tree Maps MODULE 6: MAKE TABLES * Creating Tables – Creating Tables, Highlight Tables, Heat Maps PHASE 3: GO MODULE 7: ADD CONTEXT * Reference Lines and Bands MODULE 8: MAKE MAPS * Answering Spatial Questions – Mapping, Creating a Choropleth (Filled) Map MODULE 9: MAKE DASHBOARDS * Using the Dashboard Interface * Dashboard Actions -------------------------------------------------------------------------------- This training course includes over 25 hands-on exercises and quizzes to help participants “learn by doing” and to assist group discussions around real-life use cases. Each attendee receives a login to our extensive training portal which covers the theory, practical applications and use cases, exercises, solutions and quizzes in both written and video format. Students must use their own laptop with an active version of Tableau Desktop 2018.2 (or later) pre-installed. -------------------------------------------------------------------------------- WHAT PEOPLE ARE SAYING ABOUT THIS COURSE “Excellent Trainer – knows his stuff, has done it all in the real world, not just the class room.” Richard L., Intelliflo “Tableau is a complicated and powerful tool. After taking this course, I am confident in what I can do, and how it can help improve my work.” Trevor B., Morrison Utility Services “I would highly recommend this course for Tableau beginners, really easy to follow and keep up with as you are hands on during the course. Trainer really helpful too.” Chelsey H., QVC “He is a natural trainer, patient and very good at explaining in simple terms. He has an excellent knowledge base of the system and an obvious enthusiasm for Tableau, data analysis and the best way to convey results. We had been having difficulties in the business in building financial reports from a data cube and he had solutions for these which have proved to be very useful.” Matthew H., ISS Group
Visual Analytics Best Practice
By Tableau Training Uk
This course is very much a discussion, so be prepared to present and critically analyse your own and class mates work. You will also need to bring a few examples of work you have done in the past. Learning and applying best practice visualisation principles will improve effective discussions amongst decision makers throughout your organisation. As a result more end-users of your dashboards will be able to make better decisions, more quickly. This 2 Day training course is aimed at analysts with good working knowledge of BI tools (we use Tableau to present, but attendees can use their own software such as Power BI or Qlik Sense). It is a great preparation for taking advanced certifications, such as Tableau Certified Professional. -------------------------------------------------------------------------------- Contact us to discuss the Visual Analytics Best Practice course Email us if you are interested in an on-site course, or would be interested in different dates and locations -------------------------------------------------------------------------------- This Tableau Desktop training intermediate course is designed for the professional who has a solid foundation with Tableau and is looking to take it to the next level. Attendees should have a good understanding of the fundamental concepts of building Tableau worksheets and dashboards typically achieved from having attended our Tableau Desktop Foundation Course. At the end of this course you will be able to communicate insights more effectively, enabling your organisation to make better decisions, quickly. The Tableau Desktop Analyst training course is aimed at people who are used to working with MS Excel or other Business Intelligence tools and who have preferably been using Tableau already for basic reporting. -------------------------------------------------------------------------------- THE COURSE INCLUDES THE FOLLOWING TOPICS: WHAT IS VISUAL ANALYSIS? * Visual Analytics * Visual Analytics Process * Advantages of Visual Analysis * Exercise: Interpreting Visualisations HOW DO WE PROCESS VISUAL INFORMATION? * Memory and Processing Types * Exercise: Identifying Types of Processing * Cognitive Load * Exercise: Analysing Cognitive Load * Focus and Guide the Viewer * Remove Visual Distractions * Organise Information into Chunks * Design for Proximity * Exercise: Reducing Cognitive Load SENSORY MEMORY * Pre-attentive Attributes * Quantitatively-Perceived Attributes * Categorically-Perceived Attributes * Exercise: Analysing Pre-attentive Attributes * Form & Attributes * Exercise: Using Form Effectively * Colour & Attributes * Exercise: Using Colour Effectively * Position & Attributes * Exercise: Using Position Effectively ENSURING VISUAL INTEGRITY * Informing without Misleading * Gestalt Principles * Visual Area * Axis & Scale * Colour * Detail * Exercise: Informing without Misleading CHOOSING THE RIGHT VISUALISATION * Comparing and Ranking Categories * Comparing Measures * Comparing Parts to Whole * Viewing Data Over Time * Charts Types for Mapping * Viewing Correlation * Viewing Distributions * Viewing Specific Values DASHBOARDS AND STORIES * Exercise: Picking the Chart Type * Exercise: Brainstorming Visual Best Practice * Development Process for Dashboards and Stories * Plan the Visualisation * Create the Visualisation * Test the Visualisation * Exercise: Designing Dashboards and Stories -------------------------------------------------------------------------------- This training course includes over 20 hands-on exercises to help participants “learn by doing” and to assist group discussions around real-life use cases. Each attendee receives an extensive training manual which covers the theory, practical applications and use cases, exercises and solutions together with a USB with all the materials required for the training. The course starts at 09:30 on the first day and ends at 17:00. On the second day the course starts at 09:00 and ends at 17:00. Students must bring their own laptop with an active version of Tableau Desktop 10.5 (or later) pre-installed. -------------------------------------------------------------------------------- WHAT PEOPLE ARE SAYING ABOUT THIS COURSE "Steve was willing to address questions arising from his content in a full and understandable way" Lisa L. "Really enjoyed the course and feel the subject and the way it was taught was very close to my needs" James G. "The course tutor Steve was incredibly helpful and taught the information very well while making the two days very enjoyable." Bradd P. "The host and his courses will give you the tools and confidence that you need to be comfortable with Tableau." Jack S. "Steve was fantastic with his knowledge and knowhow about the product. Where possible he made sure you could put demonstrations in to working practice, to give the audience a clear understanding." Tim H. "This was a very interesting and helpful course, which will definitely help me produce smarter, cleaner visualisations that will deliver more data-driven insights within our business." Richard A. "Steve is very open to questions and will go out of his way to answer any query. Thank you" Wasif N. "Steve was willing to address questions arising from his content in a full and understandable way" Lisa L. "Really enjoyed the course and feel the subject and the way it was taught was very close to my needs" James G.

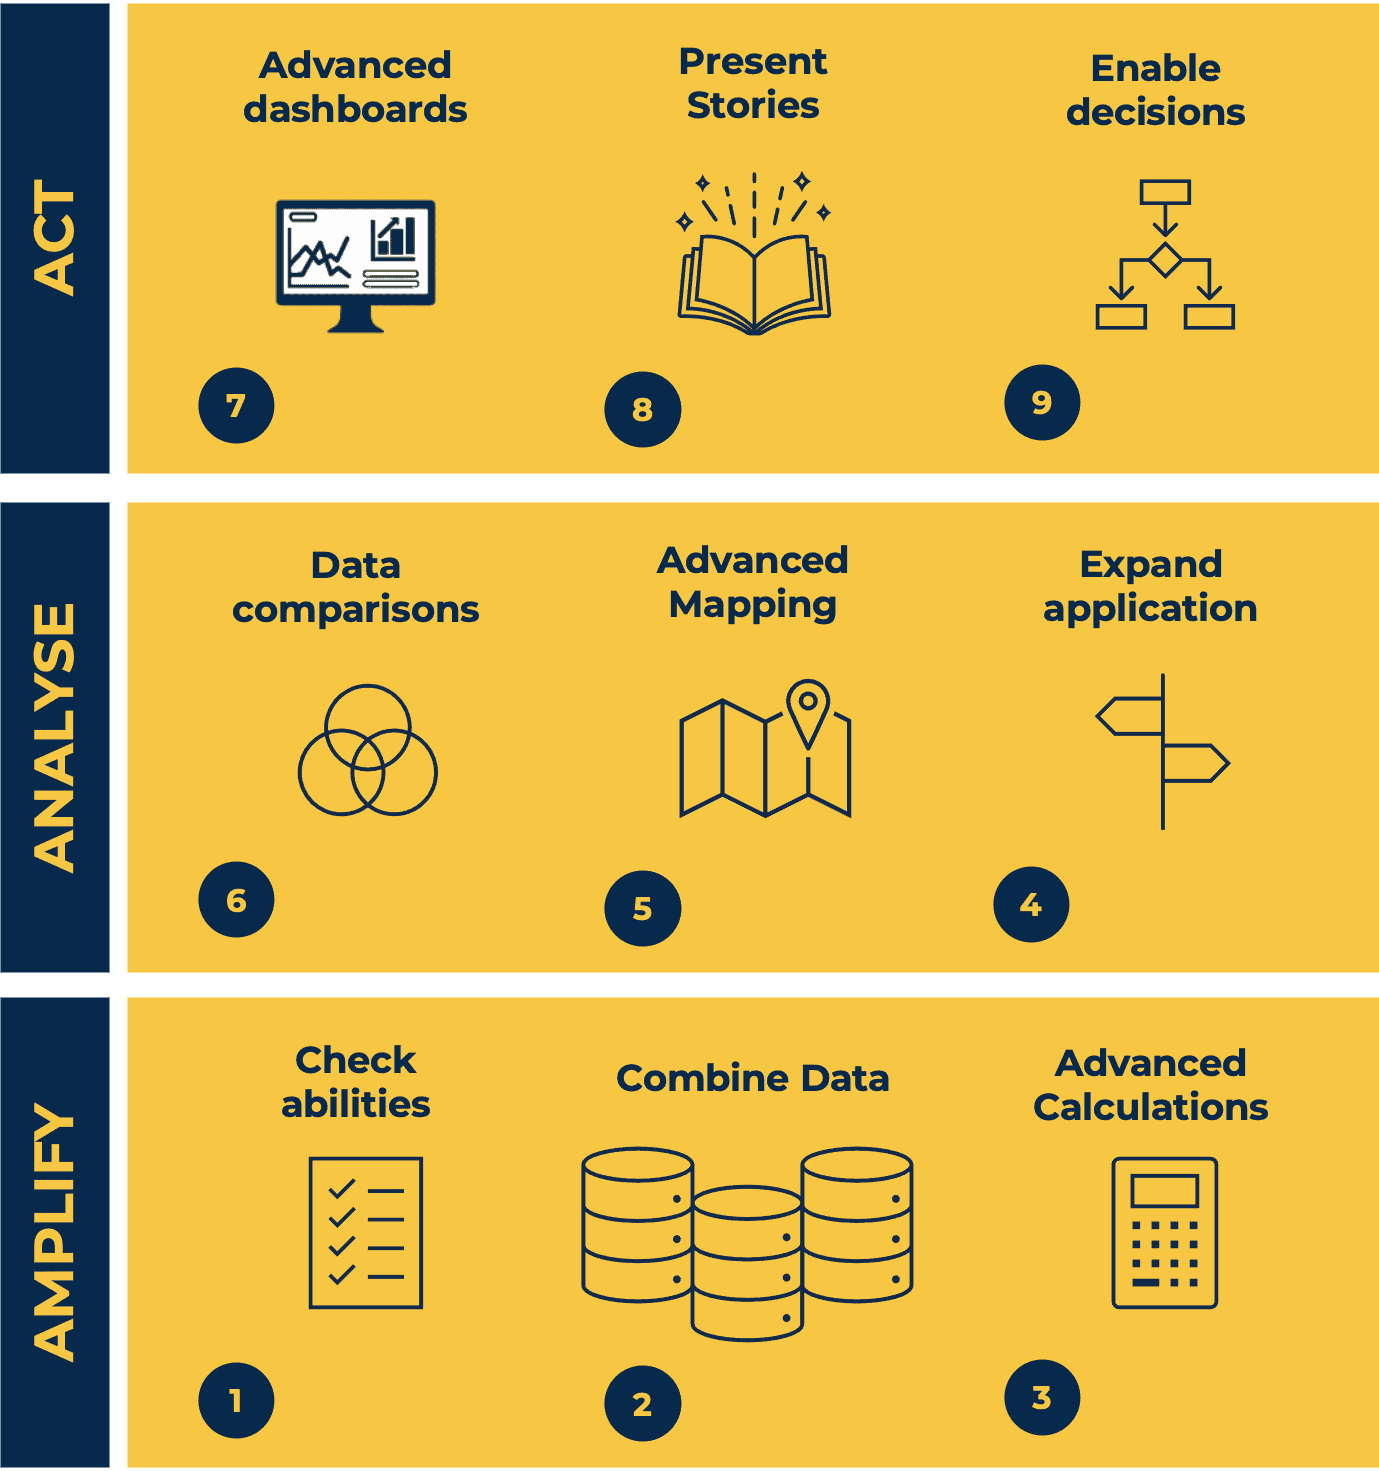
Tableau Desktop Training - Analyst
By Tableau Training Uk
This Tableau Desktop Training intermediate course is designed for the professional who has a solid foundation with Tableau and is looking to take it to the next level. -------------------------------------------------------------------------------- For Private options, online or in-person, please send us details of your requirements: -------------------------------------------------------------------------------- This Tableau Desktop training intermediate course is designed for the professional who has a solid foundation with Tableau and is looking to take it to the next level. Attendees should have a good understanding of the fundamental concepts of building Tableau worksheets and dashboards typically achieved from having attended our Tableau Desktop Foundation Course. At the end of this course you will be able to communicate insights more effectively, enabling your organisation to make better decisions, quickly. The Tableau Desktop Analyst training course is aimed at people who are used to working with MS Excel or other Business Intelligence tools and who have preferably been using Tableau already for basic reporting. -------------------------------------------------------------------------------- THE COURSE IS SPLIT INTO 3 PHASES AND 9 MODULES: PHASE 1: AMPLIFY MODULE 1: CHECK ABILITIES * Revision – What I Should Know * * What is possible * How does Tableau deal with data * Know your way around * How do we format charts * How Tableau deals with dates * Charts that compare multiple measures * Creating Tables MODULE 2: COMBINE DATA * Relationships * Joining Tables – Join Types, Joining tables within the same database, cross database joins, join calculations * Blending – How to create a blend with common fields, Custom defined Field relationships and mismatched element names, Calculated fields in blended data sources * Unions – Manual Unions and mismatched columns, Wildcard unions * Data Extracts – Creating & Editing Data extracts MODULE 3: ADVANCED CALCULATIONS * Row Level v Aggregations * Aggregating dimensions in calculations * Changing the Level of Detail (LOD) of calculations – What, Why, How * Adding Table Calculations PHASE 2: ANALYSE MODULE 4: EXPAND APPLICATION * Making things dynamic with parameters * Sets * Trend Lines * How do we format charts * Forecasting MODULE 5: ADVANCED MAPPING * Using your own images for spatial analysis * Mapping with Spatial files MODULE 6: DATA COMPARISONS Advanced Charts * Bar in Bar charts * Bullet graphs * Creating Bins and Histograms * Creating a Box & Whisker plot PHASE 3: ACT MODULE 7: ADVANCED DASHBOARDS * Using the dashboard interface and Device layout * Dashboard Actions and Viz In tooltips * Horizontal & Vertical containers * Navigate between dashboards MODULE 8: PRESENT STORIES * Telling data driven stories MODULE 9: ENABLE DECISIONS * What is Tableau Server * Publishing & Permissions * How can your users engage with content -------------------------------------------------------------------------------- This training course includes over 25 hands-on exercises and quizzes to help participants “learn by doing” and to assist group discussions around real-life use cases. Each attendee receives a login to our extensive training portal which covers the theory, practical applications and use cases, exercises, solutions and quizzes in both written and video format. Students must bring their own laptop with an active version of Tableau Desktop 2018.2 (or later) pre-installed. -------------------------------------------------------------------------------- WHAT PEOPLE ARE SAYING ABOUT THIS COURSE “Course was fantastic, and completely relevant to the work I am doing with Tableau. I particularly liked Steve’s method of teaching and how he applied the course material to ‘real-life’ use-cases.” Richard W., Dashboard Consulting Ltd “This course was extremely useful and excellent value. It helped me formalise my learning and I have taken a lot of useful tips away which will help me in everyday work.” Lauren M., Baillie Gifford “I would definitely recommend taking this course if you have a working knowledge of Tableau. Even the little tips Steve explains will make using Tableau a lot easier. Looking forward to putting what I’ve learned into practice.” Aron F., Grove & Dean “Steve is an excellent teacher and has a vast knowledge of Tableau. I learned a huge amount over the two days that I can immediately apply at work.” John B., Mporium “Steve not only provided a comprehensive explanation of the content of the course, but also allowed time for discussing particular business issues that participants may be facing. That was really useful as part of my learning process.” Juan C., Financial Conduct Authority “Course was fantastic, and completely relevant to the work I am doing with Tableau. I particularly liked Steve’s method of teaching and how he applied the course material to ‘real-life’ use-cases.” Richard W., Dashboard Consulting Ltd “This course was extremely useful and excellent value. It helped me formalise my learning and I have taken a lot of useful tips away which will help me in everyday work.” Lauren M., Baillie Gifford “I would definitely recommend taking this course if you have a working knowledge of Tableau. Even the little tips Steve explains will make using Tableau a lot easier. Looking forward to putting what I’ve learned into practice.” Aron F., Grove & Dean “Steve is an excellent teacher and has a vast knowledge of Tableau. I learned a huge amount over the two days that I can immediately apply at work.” John B., Mporium