Tableau Desktop Training - Analyst
By Tableau Training Uk
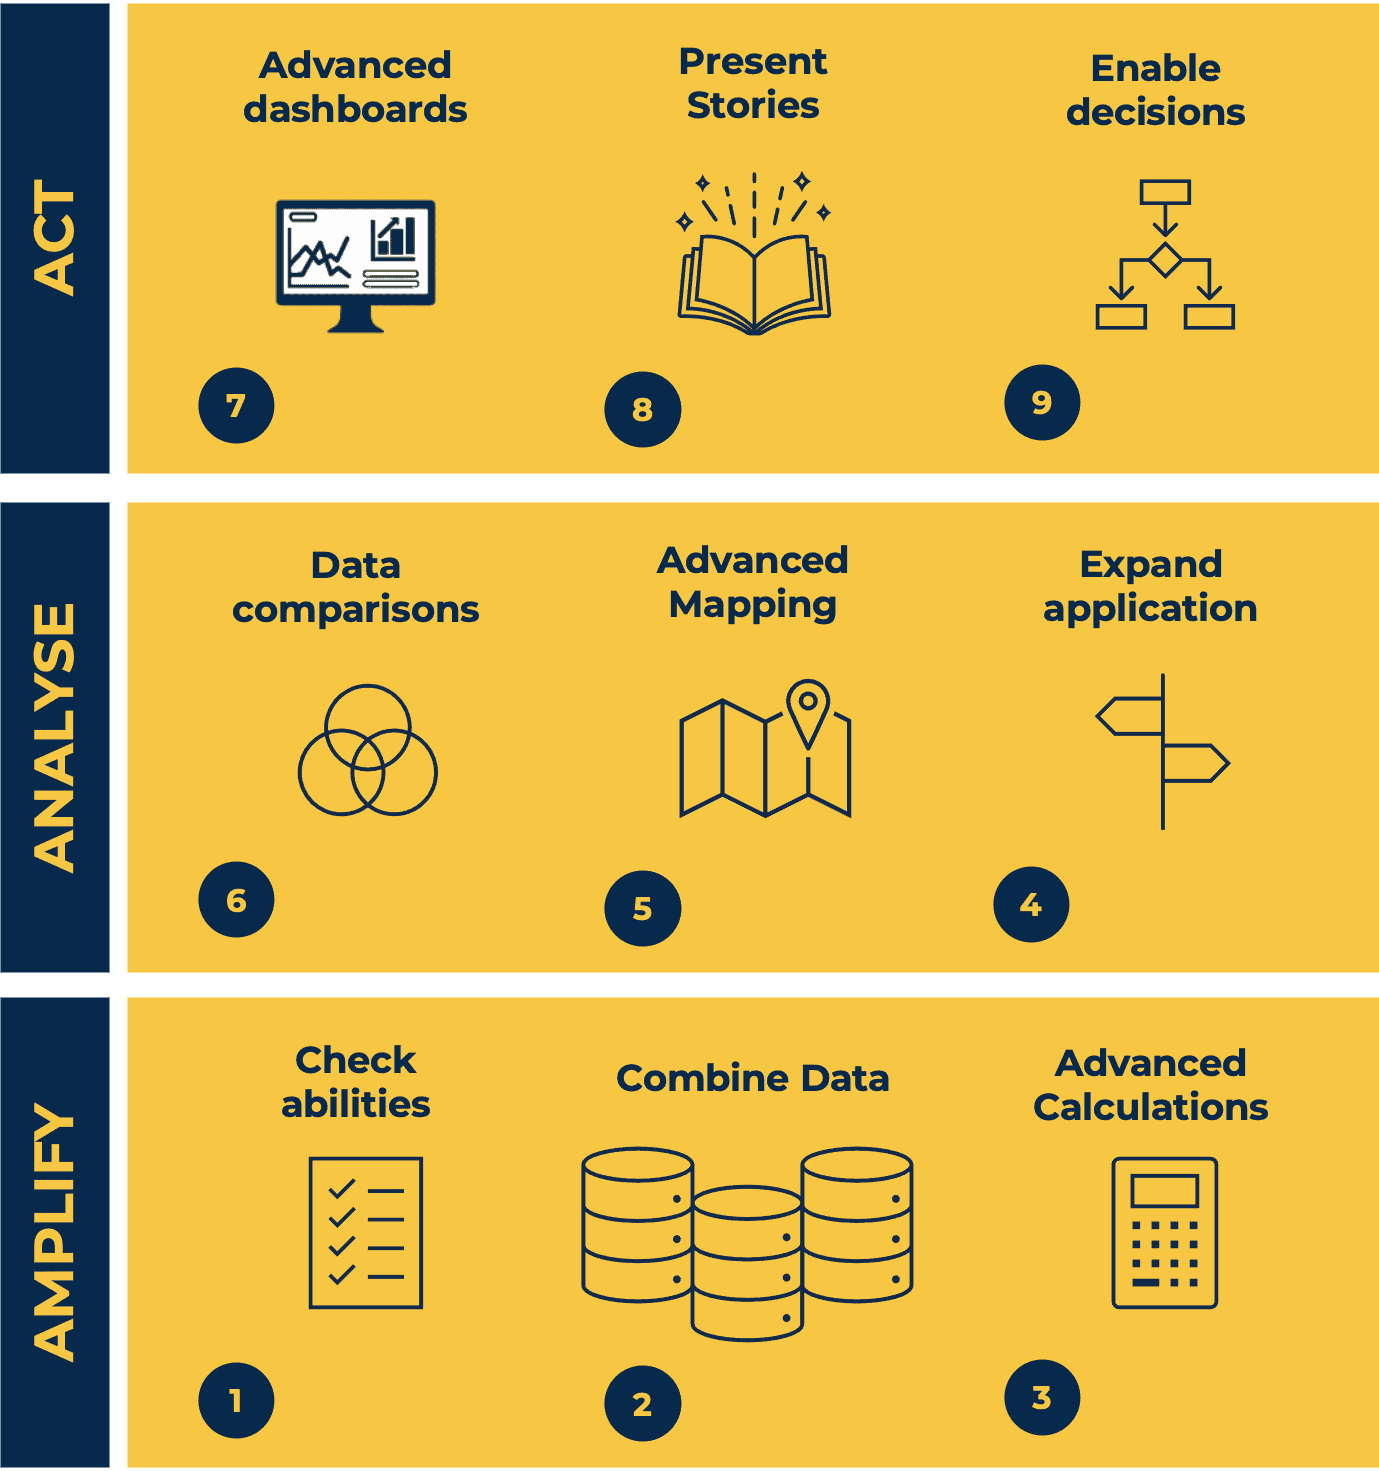
This Tableau Desktop Training intermediate course is designed for the professional who has a solid foundation with Tableau and is looking to take it to the next level. -------------------------------------------------------------------------------- For Private options, online or in-person, please send us details of your requirements: -------------------------------------------------------------------------------- This Tableau Desktop training intermediate course is designed for the professional who has a solid foundation with Tableau and is looking to take it to the next level. Attendees should have a good understanding of the fundamental concepts of building Tableau worksheets and dashboards typically achieved from having attended our Tableau Desktop Foundation Course. At the end of this course you will be able to communicate insights more effectively, enabling your organisation to make better decisions, quickly. The Tableau Desktop Analyst training course is aimed at people who are used to working with MS Excel or other Business Intelligence tools and who have preferably been using Tableau already for basic reporting. -------------------------------------------------------------------------------- THE COURSE IS SPLIT INTO 3 PHASES AND 9 MODULES: PHASE 1: AMPLIFY MODULE 1: CHECK ABILITIES * Revision – What I Should Know * * What is possible * How does Tableau deal with data * Know your way around * How do we format charts * How Tableau deals with dates * Charts that compare multiple measures * Creating Tables MODULE 2: COMBINE DATA * Relationships * Joining Tables – Join Types, Joining tables within the same database, cross database joins, join calculations * Blending – How to create a blend with common fields, Custom defined Field relationships and mismatched element names, Calculated fields in blended data sources * Unions – Manual Unions and mismatched columns, Wildcard unions * Data Extracts – Creating & Editing Data extracts MODULE 3: ADVANCED CALCULATIONS * Row Level v Aggregations * Aggregating dimensions in calculations * Changing the Level of Detail (LOD) of calculations – What, Why, How * Adding Table Calculations PHASE 2: ANALYSE MODULE 4: EXPAND APPLICATION * Making things dynamic with parameters * Sets * Trend Lines * How do we format charts * Forecasting MODULE 5: ADVANCED MAPPING * Using your own images for spatial analysis * Mapping with Spatial files MODULE 6: DATA COMPARISONS Advanced Charts * Bar in Bar charts * Bullet graphs * Creating Bins and Histograms * Creating a Box & Whisker plot PHASE 3: ACT MODULE 7: ADVANCED DASHBOARDS * Using the dashboard interface and Device layout * Dashboard Actions and Viz In tooltips * Horizontal & Vertical containers * Navigate between dashboards MODULE 8: PRESENT STORIES * Telling data driven stories MODULE 9: ENABLE DECISIONS * What is Tableau Server * Publishing & Permissions * How can your users engage with content -------------------------------------------------------------------------------- This training course includes over 25 hands-on exercises and quizzes to help participants “learn by doing” and to assist group discussions around real-life use cases. Each attendee receives a login to our extensive training portal which covers the theory, practical applications and use cases, exercises, solutions and quizzes in both written and video format. Students must bring their own laptop with an active version of Tableau Desktop 2018.2 (or later) pre-installed. -------------------------------------------------------------------------------- WHAT PEOPLE ARE SAYING ABOUT THIS COURSE “Course was fantastic, and completely relevant to the work I am doing with Tableau. I particularly liked Steve’s method of teaching and how he applied the course material to ‘real-life’ use-cases.” Richard W., Dashboard Consulting Ltd “This course was extremely useful and excellent value. It helped me formalise my learning and I have taken a lot of useful tips away which will help me in everyday work.” Lauren M., Baillie Gifford “I would definitely recommend taking this course if you have a working knowledge of Tableau. Even the little tips Steve explains will make using Tableau a lot easier. Looking forward to putting what I’ve learned into practice.” Aron F., Grove & Dean “Steve is an excellent teacher and has a vast knowledge of Tableau. I learned a huge amount over the two days that I can immediately apply at work.” John B., Mporium “Steve not only provided a comprehensive explanation of the content of the course, but also allowed time for discussing particular business issues that participants may be facing. That was really useful as part of my learning process.” Juan C., Financial Conduct Authority “Course was fantastic, and completely relevant to the work I am doing with Tableau. I particularly liked Steve’s method of teaching and how he applied the course material to ‘real-life’ use-cases.” Richard W., Dashboard Consulting Ltd “This course was extremely useful and excellent value. It helped me formalise my learning and I have taken a lot of useful tips away which will help me in everyday work.” Lauren M., Baillie Gifford “I would definitely recommend taking this course if you have a working knowledge of Tableau. Even the little tips Steve explains will make using Tableau a lot easier. Looking forward to putting what I’ve learned into practice.” Aron F., Grove & Dean “Steve is an excellent teacher and has a vast knowledge of Tableau. I learned a huge amount over the two days that I can immediately apply at work.” John B., Mporium
Introduction to Data Science - free for Medway residents
By futureCoders SE
Learn the basics of Data Science, combining a supported #CISCO Skills for All online course with practical learning and a project to help consolidate the learning.
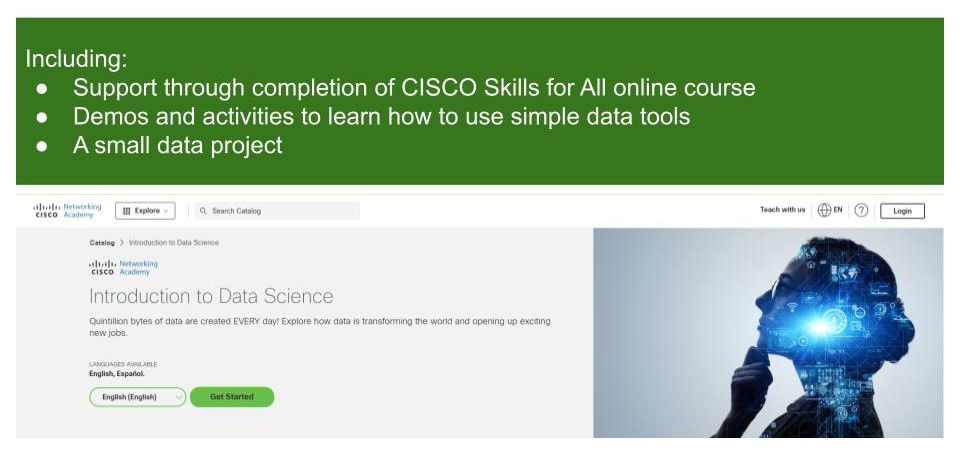
Tableau Desktop Training - Foundation
By Tableau Training Uk
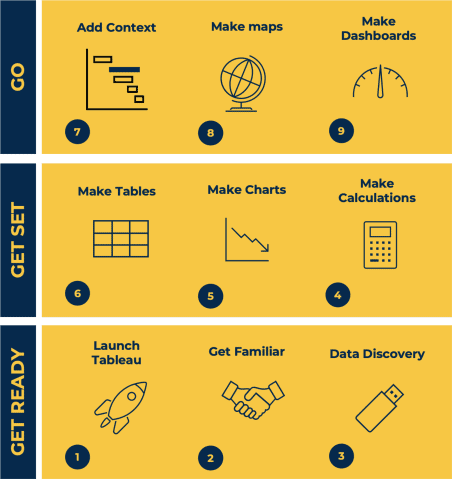
This Tableau Desktop Training course is a jumpstart to getting report writers and analysts with little or no previous knowledge to being productive. It covers everything from connecting to data, through to creating interactive dashboards with a range of visualisations in two days of your time. -------------------------------------------------------------------------------- For Private options, online or in-person, please send us details of your requirements: -------------------------------------------------------------------------------- This Tableau Desktop Training course is a jumpstart to getting report writers and analysts with little or no previous knowledge to being productive. It covers everything from connecting to data, through to creating interactive dashboards with a range of visualisations in two days of your time. Having a quick turnaround from starting to use Tableau, to getting real, actionable insights means that you get a swift return on your investment of time and money. This accelerated approach is key to getting engagement from within your organisation so everyone can immediately see and feel the impact of the data and insights you create. This course is aimed at someone who has not used Tableau in earnest and may be in a functional role, eg. in sales, marketing, finance, operations, business intelligence etc. -------------------------------------------------------------------------------- THE COURSE IS SPLIT INTO 3 PHASES AND 9 MODULES: PHASE 1: GET READY MODULE 1: LAUNCH TABLEAU * Check Install & Setup * Why is Visual Analytics Important MODULE 2: GET FAMILIAR * What is possible * How does Tableau deal with data * Know your way around * How do we format charts * Dashboard Basics – My First Dashboard MODULE 3: DATA DISCOVERY * Connecting to and setting up data in Tableau * How Do I Explore my Data – Filters & Sorting * How Do I Structure my Data – Groups & Hierarchies, Visual Groups * How Tableau Deals with Dates – Using Discrete and Continuous Dates, Custom Dates PHASE 2: GET SET MODULE 4: MAKE CALCULATIONS * How Do I Create Calculated Fields & Why MODULE 5: MAKE CHARTS * Charts that Compare Multiple Measures – Measure Names and Measure Values, Shared Axis Charts, Dual Axis Charts, Scatter Plots * Showing Relational & Proportional Data – Pie Charts, Donut Charts, Tree Maps MODULE 6: MAKE TABLES * Creating Tables – Creating Tables, Highlight Tables, Heat Maps PHASE 3: GO MODULE 7: ADD CONTEXT * Reference Lines and Bands MODULE 8: MAKE MAPS * Answering Spatial Questions – Mapping, Creating a Choropleth (Filled) Map MODULE 9: MAKE DASHBOARDS * Using the Dashboard Interface * Dashboard Actions -------------------------------------------------------------------------------- This training course includes over 25 hands-on exercises and quizzes to help participants “learn by doing” and to assist group discussions around real-life use cases. Each attendee receives a login to our extensive training portal which covers the theory, practical applications and use cases, exercises, solutions and quizzes in both written and video format. Students must use their own laptop with an active version of Tableau Desktop 2018.2 (or later) pre-installed. -------------------------------------------------------------------------------- WHAT PEOPLE ARE SAYING ABOUT THIS COURSE “Excellent Trainer – knows his stuff, has done it all in the real world, not just the class room.” Richard L., Intelliflo “Tableau is a complicated and powerful tool. After taking this course, I am confident in what I can do, and how it can help improve my work.” Trevor B., Morrison Utility Services “I would highly recommend this course for Tableau beginners, really easy to follow and keep up with as you are hands on during the course. Trainer really helpful too.” Chelsey H., QVC “He is a natural trainer, patient and very good at explaining in simple terms. He has an excellent knowledge base of the system and an obvious enthusiasm for Tableau, data analysis and the best way to convey results. We had been having difficulties in the business in building financial reports from a data cube and he had solutions for these which have proved to be very useful.” Matthew H., ISS Group
Agile: an introduction (In-House)
By The In House Training Company
Agility has become a prized business attribute. Although Agile methods were once most associated with software development, they are now applied in a host of different areas. Agile continues to find new applications because it is primarily an attitude. This programme delivers a solid grounding in both the Agile mindset and Agile methods. It covers three methods, illustrates the benefits of each and shows how they can be integrated. It includes practical techniques as well as background knowledge. By the end of the session, participants will be able to: * Apply Agile concepts to self-manage their work * Understand the roles people take on in Agile teams * Use a variety of techniques to help deliver customer satisfaction * Focus on delivering against priorities * Employ a range of estimating techniques 1 INTRODUCTION * Overview of the programme * Review of participants' needs and objectives 2 THE BASICS OF AGILE * What makes Agile different * Agile Manifesto and Principles * Using feedback to deliver what is needed 3 AGILE TEAMS * Multi-disciplinary teams * Team size and empowerment * Agile values 4 AGILE AT THE TEAM LEVEL - SCRUM * Scrum roles * Scrum 'events' * Scrum 'artifacts' 5 AGILE FOR TEAMS JUGGLING MULTIPLE DEMANDS - KANBAN * Taking control of the work * Improving throughput * Dealing with bottlenecks 6 AGILE IN PROJECTS - AGILEPM * The phases of an Agile project * Managing change requests * Delivering on time 7 ESTIMATING * T-shirt / Pebble sizing * Yesterday's weather * Planning poker 8 PICK 'N' MIX - SOME USEFUL TECHNIQUES * The daily stand-up * User stories * Retrospectives * Work-in-process limits * Burndown charts * Minimum viable product * A / B testing 9 REVIEW AND ACTION PLANNING * Identify actions to be implemented individually * Conclusion

Excel - introduction (In-House)
By The In House Training Company
This one-day workshop is designed to give you an awareness of the fundamentals of Microsoft Excel and, in particular, to give you the confidence needed to efficiently create, edit and manage spreadsheets. This course will help participants: * Create tables * Use functions * Manage rows and columns * Write formulas * Manage sheets * Use content formats * Handle larger tables * Create reports and charts 1 CREATING A TABLE * Creating an Excel table from scratch * Wrapping text in cells * Speeding up data entry using AutoFill * Sorting columns 2 INSERTING FUNCTION * Inserting function calculators * Using AutoSum to sum numbers * Statistical calculations AVERAGE, MAX and MIN 3 TABLE ROWS AND COLUMNS * Inserting and deleting rows and columns * Adjusting multiple column widths and row heights * Hiding and unhiding rows and columns 4 FORMULA WRITING * The basics of formula writing * Understanding mathematical symbols * Using multiple mathematical symbols in a formula * When to use brackets * Troubleshooting calculation errors 5 MANAGING SHEETS * Inserting, renaming, moving and deleting sheets * Copying a worksheet to another file * Copying a table to another sheet 6 MANAGING CONTENT FORMATS * Applying data formats * Managing number formats * Controlling formats with the Format Painter 7 MANAGING LARGER TABLES * Applying freeze panes to lock tables when scrolling * Sorting on multiple columns * Using filters to extract table information 8 CREATING AND MODIFYING CHARTS * Creating a pie chart * Creating a column chart * Inserting chart titles and data labels * Controlling chart formatting * Changing chart types 9 PRINTING * Previewing and printing tables and charts * Modifying page orientation * Adjusting print margins * Printing a selection 10 CALCULATING WITH ABSOLUTE REFERENCE * The difference between a relative and absolute formula * Changing a relative formula to an absolute * Using $ signs to lock cells when copying formulas 11 PIVOT TABLES * Create a pivot table report * Insert a pivot chart into a report
Introduction to health and safety - best-practice (In-House)
By The In House Training Company
Health and safety awareness training is mandatory for staff at all levels of an organisation. This is the ideal course to satisfy that requirement - a stimulating 'entry-level' programme explaining how health and safety should be managed in any working environment. The course outlines the basics of health and safety law and how organisations and individuals can become liable for health and safety offences. Roles and responsibilities for health and safety are discussed by reference to the key legislation and the expert trainer will explore with the delegates how these responsibilities are managed in practice in different types of organisation. The principles of risk assessment will be considered and their practical implementation discussed in relation to the management of the various hazards that are likely to be present in a typical workplace. This course will give staff: * An understanding of health and safety law, liability and enforcement * An explanation of the principles of health and safety management in the workplace and an understanding of who should be responsible for different aspects of health and safety * A practical explanation of risk assessment and what constitutes a suitable and sufficient assessment * A broad knowledge of the typical hazards in a workplace and how these should be managed 1 OVERVIEW OF HEALTH AND SAFETY LAW * Statute and civil law * Liability and enforcement * Statutory duties * Contract law 2 LEGISLATIVE FRAMEWORK * The workplace - extent of responsibility / shared responsibility * Relevant legislation 3 MANAGEMENT OF HEALTH AND SAFETY * Health and Safety at Work etc Act 1974 * Management of Health and Safety at Work Regulations 1999 * Workplace (Health, Safety and Welfare) Regulations 1992 * Accident Reporting (RIDDOR) * Consultation with Employees and Safety Committees 4 RISK MANAGEMENT WITHIN YOUR ORGANISATION * Business risk management * Health and safety risk management * The principles of risk assessment * Transferring the risk to contractors and third parties 5 RISK ASSESSMENT EXERCISE - 'CHALLENGE ANNEKA' 6 MANAGING THE HAZARDS IN THE WORKPLACE * Work equipment * Lifting equipment * Display screens * Manual handling * Fire * Chemicals (COSHH) * Personal protective equipment (PPE) 7 PRACTICAL EXERCISE - WORKPLACE INSPECTION 8 QUESTIONS, DISCUSSION AND REVIEW
Negotiation skills (In-House)
By The In House Training Company
Any successful business manager will tell you that you never get the deal you deserve - you always get the deal you negotiate! This two-day workshop includes recent research and practical techniques from the Harvard Business School Negotiation Project and provides a unique opportunity to learn and practice these skills in a safe environment using up to date materials and life-like practice negotiation case studies. This course will help participants to: * Understand the basics of negotiation * Develop negotiating skills * Increase their business acumen * Develop their communication skills * Learn the models, techniques and tools for an effective negotiation * Identify the barriers to agreements * Close the deal 1 WHAT IS NEGOTIATION? * Key skills for negotiation * Types of negotiation * Win-lose negotiations versus Win-win negotiations * Wise agreements and Principled Negotiation 2 FOUR KEY NEGOTIATING CONCEPTS * BATNA - Best alternative to negotiated agreement * Setting your reservation price * ZOPA - Zone of possible agreement * Creating and trading value 3 BUSINESS ACUMEN * Understanding pricing, gross margins and profit * Knowing the key points on which to negotiate 4 A FOUR PHASE MODEL FOR NEGOTIATION * Nine steps to successful planning * Discussing a deal - creating and claiming value * Making and framing proposals * Bargaining for the winning deal 5 EFFECTIVE COMMUNICATION * Effective questioning * Active listening skills * Understanding and interpreting body language * Barriers to effective communication 6 UNDERSTANDING INFLUENCE AND PERSUASION * Influencing strategies * Ten proven ways to influence people * Six universal methods of persuasion * Understanding why people do business with other people 7 NEGOTIATING TACTICS * Tactics for win-lose negotiations * Tactics for win-win negotiations * Effective team negotiating * Understanding and using powerv * What do you do when the other side has more power? 8 BARRIERS TO AGREEMENT * Common barriers to agreement * The Negotiators Dilemma * Dealing with die-hard negotiators * Dealing with lack of trust 9 POTENTIAL BARRIERS TO CROSS-BORDER AGREEMENTS * Understanding business methods and practice in other cultures * Figuring out who has the power and who makes decisions * Recognising and dealing with cultural differences * What's OK here might not be OK there 10 CLOSING THE DEAL * Four steps to closing the winning deal
Commercial instinct (In-House)
By The In House Training Company
An insightful, enjoyable and experiential programme to help you analyse data and information and make a balanced decision based upon sound commercial reasoning. It will enable you to identify options, make decisions and take actions based on a thorough analysis combined with instinct and intuition to make a positive effect on profitability. This programme will help you: * Identify ways to analyse data and sort relevant from irrelevant information * Develop analytical and numerate thinking, and consider the financial implications of a decision * Make decisions based on sound commercial reasoning - a mix of intuition and analysis * Select from a range of tools to analyse a situation and apply these effectively * Understand how costs and profits are calculated * Use tried-and-tested techniques to manage and control your budgets * Appreciate the fundamentals of financial analysis * Focus on the bottom line * Identify the basics of capital investment appraisal for your business * Evaluate results and seek opportunities for improvement to your business 1 THE COMMERCIAL ENVIRONMENT * What do shareholders and investors want? * What do managers want? * Profit v non-profit organisations * Investor expectations 2 FINANCIAL AND NON-FINANCIAL INFORMATION * Risk and reward considerations * Drivers of commercial decisions 3 RUNNING A BUSINESS * A practical exercise to bring financial statements to life * Different stakeholder interests in a business * The impact and consequences of decisions on financial statements 4 WHERE DO I MAKE A DIFFERENCE TO THE ORGANISATION? * How can I contribute to an improved business performance? * Key performance indicators - measuring the right things * A 'balanced scorecard' approach - it's not all about money! 5 A 'BALANCED SCORECARD' APPROACH * Analysing and reviewing my contribution to the business direction * What is the current focus of my commercial decisions? * Developing the business in the right way - getting the balance right! * Where should/could it be in the future? * Do my decisions support the overall vision and strategy? 6 MAKING COMMERCIAL DECISIONS * Left-brain and right-brain thinking * Convergent and divergent thinking * Analysis and instinct * Interactive case study exercise - emotional and rational decisions * Reflection - what is my style of making decisions 7 LET'S CONSIDER THE CUSTOMER! * Identifying target markets * Differentiating propositions and products * Customer service considerations * Marketing considerations and initiatives * Pricing strategies and considerations 8 STRATEGIC ANALYSIS * The external environment * The internal environment * LEPEST analysis * SWOT analysis * Forecasting * Group activity - analysing markets and the competition * How do these improve your decisions? 9 COMPARING PERFORMANCE * Analysing key financial ratios * Ways to compare performance and results * Break-even analysis 10 PROFIT AND LOSS ACCOUNTS AND BUDGETING * Managing income and expenditure * The budgeting process * How does this link to the profit and loss account? * Managing and controlling a cost centre/budget * The role of the finance department * Different ways of budgeting * Incremental budgeting * Zero-based budgeting 11 UNDERSTANDING THE BALANCE SHEET * Purpose of balance sheets * Understanding and navigating the content * What does a balance sheet tell you? * How do you affect your balance sheet? * Links to the profit and loss account * A practical team exercise that brings financial statements to life 12 BUSINESS DECISIONS EXERCISE * How does this improve your decisions? * A practical exercise to apply new knowledge and bring commercial thinking to to life * The impact and consequences of decisions on financial statements 13 WORKING CAPITAL * Why is this important? * The importance of keeping cash flowing * Business decisions that affect cash * Calculating profit 14 CAPITAL INVESTMENT APPRAISAL * Capex v Opex * Payback * Return on investment * The future value of money * The concept of hurdle rate 15 LESSONS LEARNED AND ACTION PLANNING * So what? * Recap and consolidation of learning * The decisions that I need to consider * Actions to achieve my plan
Baby & Child First Aid - Combined Learning
By Mini First Aid North Nottinghamshire, Grantham & Sleaford
The 3-hour Baby & Child First Aid class covers CPR, Choking, Bumps, Burns, Breaks, Bleeding, Febrile Seizures and Meningitis & Sepsis Awareness and will give everyone who attends the peace of mind they deserve.