268 Courses


Online & interactive Women's Health and Holistic wellbeing course.
By lindsay wild
This is an accredited course with the International practitioners of Holistic medicine for women personally or professionally to transform their life. Relax, be calm, you've got this!

Advanced Diploma in Statistics & Probability for Data Science & Machine Learning at QLS Level 7
(2)By Studyhub UK
Do you want to master the essential mathematical skills for data science and machine learning? Do you want to learn how to apply statistics and probability to real-world problems and scenarios? If yes, then this course is for you! In this course, you will learn the advanced concepts and techniques of statistics and probability that are widely used in data science and machine learning. You will learn how to describe and analyse data using descriptive statistics, distributions, and probability theory. You will also learn how to perform hypothesis testing, regressions, ANOVA, and machine learning algorithms to make predictions and inferences from data. You will gain hands-on experience with practical exercises and projects using Python and R. Learning Outcomes By the end of this course, you will be able to: * Apply descriptive statistics, distributions, and probability theory to summarise and visualise data * Perform hypothesis testing, regressions, ANOVA, and machine learning algorithms to make predictions and inferences from data * Use Python and R to implement statistical and machine learning methods * Interpret and communicate the results of your analysis using appropriate metrics and visualisations * Solve real-world problems and scenarios using statistics and probability WHY CHOOSE THIS ADVANCED DIPLOMA IN STATISTICS & PROBABILITY FOR DATA SCIENCE & MACHINE LEARNING AT QLS LEVEL 7 COURSE? 1. Unlimited access to the course for a lifetime. 2. Opportunity to earn a certificate accredited by the CPD Quality Standards and CIQ after completing this course. 3. Structured lesson planning in line with industry standards. 4. Immerse yourself in innovative and captivating course materials and activities. 5. Assessments designed to evaluate advanced cognitive abilities and skill proficiency. 6. Flexibility to complete the Course at your own pace, on your own schedule. 7. Receive full tutor support throughout the week, from Monday to Friday, to enhance your learning experience. 8. Unlock career resources for CV improvement, interview readiness, and job success. WHO IS THIS ADVANCED DIPLOMA IN STATISTICS & PROBABILITY FOR DATA SCIENCE & MACHINE LEARNING AT QLS LEVEL 7 COURSE FOR? This course is for anyone who wants to learn the advanced concepts and techniques of statistics and probability for data science and machine learning. This course is suitable for: * Data scientists, machine learning engineers, and analysts who want to enhance their skills and knowledge * Students and researchers who want to learn the mathematical foundations of data science and machine learning * Professionals and managers who want to understand and apply data-driven decision making * Hobbyists and enthusiasts who want to explore and learn from data * Anyone who loves statistics and probability and wants to challenge themselves CAREER PATH * Data Scientist (£35,000 - £55,000) * Machine Learning Engineer (£40,000 - £60,000) * Statistician (£35,000 - £55,000) * Data Analyst (£40,000 - £60,000) * Business Intelligence Analyst (£45,000 - £65,000) * Senior Data Analyst (£50,000 - £70,000) PREREQUISITES This Advanced Diploma in Statistics & Probability for Data Science & Machine Learning at QLS Level 7 does not require you to have any prior qualifications or experience. You can just enrol and start learning.This Advanced Diploma in Statistics & Probability for Data Science & Machine Learning at QLS Level 7 was made by professionals and it is compatible with all PC's, Mac's, tablets and smartphones. You will be able to access the course from anywhere at any time as long as you have a good enough internet connection. CERTIFICATION After studying the course materials, there will be a written assignment test which you can take at the end of the course. After successfully passing the test you will be able to claim the pdf certificate for £4.99 Original Hard Copy certificates need to be ordered at an additional cost of £8. Endorsed Certificate of Achievement from the Quality Licence Scheme Learners will be able to achieve an endorsed certificate after completing the course as proof of their achievement. You can order the endorsed certificate for only £135 to be delivered to your home by post. For international students, there is an additional postage charge of £10. Endorsement The Quality Licence Scheme (QLS) has endorsed this course for its high-quality, non-regulated provision and training programmes. The QLS is a UK-based organisation that sets standards for non-regulated training and learning. This endorsement means that the course has been reviewed and approved by the QLS and meets the highest quality standards. Please Note: Studyhub is a Compliance Central approved resale partner for Quality Licence Scheme Endorsed courses. COURSE CURRICULUM Section 01: Let's get started Welcome! 00:02:00 What will you learn in this course? 00:06:00 How can you get the most out of it? 00:06:00 Section 02: Descriptive statistics Intro 00:03:00 Mean 00:06:00 Median 00:05:00 Mode 00:04:00 Mean or Median? 00:08:00 Skewness 00:08:00 Practice: Skewness 00:01:00 Solution: Skewness 00:03:00 Range & IQR 00:10:00 Sample vs. Population 00:05:00 Variance & Standard deviation 00:11:00 Impact of Scaling & Shifting 00:19:00 Statistical moments 00:06:00 Section 03: Distributions What is a distribution? 00:10:00 Normal distribution 00:09:00 Z-Scores 00:13:00 Practice: Normal distribution 00:04:00 Solution: Normal distribution 00:07:00 Section 04: Probability theory Intro 00:01:00 Probability Basics 00:10:00 Calculating simple Probabilities 00:05:00 Practice: Simple Probabilities 00:01:00 Quick solution: Simple Probabilities 00:01:00 Detailed solution: Simple Probabilities 00:06:00 Rule of addition 00:13:00 Practice: Rule of addition 00:02:00 Quick solution: Rule of addition 00:01:00 Detailed solution: Rule of addition 00:07:00 Rule of multiplication 00:11:00 Practice: Rule of multiplication 00:01:00 Solution: Rule of multiplication 00:03:00 Bayes Theorem 00:10:00 Bayes Theorem - Practical example 00:07:00 Expected value 00:11:00 Practice: Expected value 00:01:00 Solution: Expected value 00:03:00 Law of Large Numbers 00:08:00 Central Limit Theorem - Theory 00:10:00 Central Limit Theorem - Intuition 00:08:00 Central Limit Theorem - Challenge 00:11:00 Central Limit Theorem - Exercise 00:02:00 Central Limit Theorem - Solution 00:14:00 Binomial distribution 00:16:00 Poisson distribution 00:17:00 Real life problems 00:15:00 Section 05: Hypothesis testing Intro 00:01:00 What is a hypothesis? 00:19:00 Significance level and p-value 00:06:00 Type I and Type II errors 00:05:00 Confidence intervals and margin of error 00:15:00 Excursion: Calculating sample size & power 00:11:00 Performing the hypothesis test 00:20:00 Practice: Hypothesis test 00:01:00 Solution: Hypothesis test 00:06:00 T-test and t-distribution 00:13:00 Proportion testing 00:10:00 Important p-z pairs 00:08:00 Section 06: Regressions Intro 00:02:00 Linear Regression 00:11:00 Correlation coefficient 00:10:00 Practice: Correlation 00:02:00 Solution: Correlation 00:08:00 Practice: Linear Regression 00:01:00 Solution: Linear Regression 00:07:00 Residual, MSE & MAE 00:08:00 Practice: MSE & MAE 00:01:00 Solution: MSE & MAE 00:03:00 Coefficient of determination 00:12:00 Root Mean Square Error 00:06:00 Practice: RMSE 00:01:00 Solution: RMSE 00:02:00 Section 07: Advanced regression & machine learning algorithms Multiple Linear Regression 00:16:00 Overfitting 00:05:00 Polynomial Regression 00:13:00 Logistic Regression 00:09:00 Decision Trees 00:21:00 Regression Trees 00:14:00 Random Forests 00:13:00 Dealing with missing data 00:10:00 Section 08: ANOVA (Analysis of Variance) ANOVA - Basics & Assumptions 00:06:00 One-way ANOVA 00:12:00 F-Distribution 00:10:00 Two-way ANOVA - Sum of Squares 00:16:00 Two-way ANOVA - F-ratio & conclusions 00:11:00 Section 09: Wrap up Wrap up 00:01:00 Assignment Assignment - Statistics & Probability for Data Science & Machine Learning 00:00:00 Order your QLS Endorsed Certificate Order your QLS Endorsed Certificate 00:00:00

Power BI - introduction to intermediate (2 days) (In-House)
By The In House Training Company
This course starts with the basics then moves seamlessly to an intermediate level. It includes a comprehensive yet balanced look at the four main components that make up Power BI Desktop: Report view, Data view, Model view, and the Power Query Editor. It also demonstrates how to use the online Power BI service. It looks at authoring tools that enables you to connect to and transform data from a variety of sources, allowing you to produce dynamic reports using a library of visualisations. Once you have those reports, the course looks at the seamless process of sharing those with your colleagues by publishing to the online Power BI service. The aim of this course is to provide a strong understanding of the Power BI analysis process, by working with real-world examples that will equip you with the necessary skills to start applying your knowledge straight away. 1 GETTING STARTED * The Power BI process * Launching Power BI Desktop * The four views of Power BI * Dashboard visuals 2 CONNECTING TO FILES * Connect to data sources * Connect to an Excel file * Connect to a CSV file * Connect to a database * Import vs. DirectQuery * Connect to a web source * Create a data table 3 TRANSFORMING DATA * The process of cleaning data * Column data types * Remove rows with filters * Add a custom column * Append data to a table * Fix error issues * Basic maths operations 4 BUILD A DATA MODEL * Table relationships * Manage table relationships 5 MERGE QUERIES * Table join kinds * Merging tables 6 CREATE REPORT VISUALISATIONS * Creating map visuals * Formatting maps * Creating chart visuals * Formatting chart * Tables, matrixes, and cards * Control formatting with themes * Filter reports with slicers * Reports for mobile devices * Custom online visuals * Export report data to Excel 7 THE POWER QUERY EDITOR * Fill data up and down * Split columns by delimiter * Add conditional columns * Merging columns 8 THE M FORMULA * Creating M functions * Create an IF function * Create a query group 9 PIVOT AND UNPIVOT TABLES * Pivot tables in the query editor * Pivot and append tables * Pivot but don't summarise * Unpivot tables * Append mismatched headers 10 DATA MODELLING REVISITED * Data model relationships * Mark a calendar as a date table 11 INTRODUCTION TO CALCULATED COLUMNS * New columns vs. measures * Creating a new column calculation * The SWITCH function 12 INTRODUCTION TO DAX MEASURES * Common measure categories * The SUM measure * Adding measures to visuals * COUNTROWS and DISINCTCOUNT functions * DAX rules 13 THE CALCULATE MEASURE * The syntax of CALCULATE * Things of note about CALCULATE 14 THE SUMX MEASURE * The SUMX measure * X iterator functions * Anatomy of SUMX 15 INTRODUCTION TO TIME INTELLIGENCE * Importance of a calendar table * A special lookup table * The TOTALYTD measure * Change year end in TOTALYTD 16 HIERARCHY, GROUPS AND FORMATTING * Create a hierarchy to drill data * Compare data in groups * Add conditional formatting 17 SHARE REPORTS ON THE WEB * Publish to the BI online service * Get quick insights * Upload reports from BI service * Exporting report data * What is Q&A? * Sharing your reports 18 APPLY YOUR LEARNING * Post training recap lesson

Tableau Desktop Training - Foundation
By Tableau Training Uk
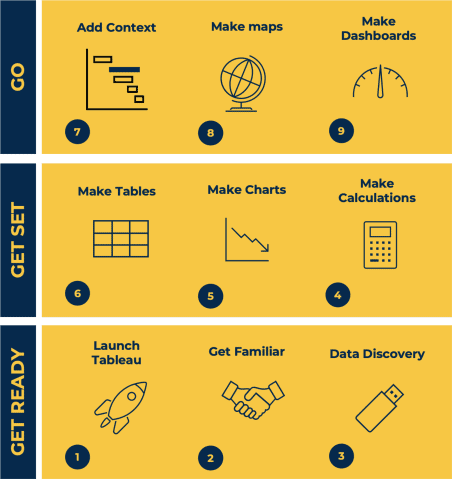
This Tableau Desktop Training course is a jumpstart to getting report writers and analysts with little or no previous knowledge to being productive. It covers everything from connecting to data, through to creating interactive dashboards with a range of visualisations in two days of your time. -------------------------------------------------------------------------------- For Private options, online or in-person, please send us details of your requirements: -------------------------------------------------------------------------------- This Tableau Desktop Training course is a jumpstart to getting report writers and analysts with little or no previous knowledge to being productive. It covers everything from connecting to data, through to creating interactive dashboards with a range of visualisations in two days of your time. Having a quick turnaround from starting to use Tableau, to getting real, actionable insights means that you get a swift return on your investment of time and money. This accelerated approach is key to getting engagement from within your organisation so everyone can immediately see and feel the impact of the data and insights you create. This course is aimed at someone who has not used Tableau in earnest and may be in a functional role, eg. in sales, marketing, finance, operations, business intelligence etc. -------------------------------------------------------------------------------- THE COURSE IS SPLIT INTO 3 PHASES AND 9 MODULES: PHASE 1: GET READY MODULE 1: LAUNCH TABLEAU * Check Install & Setup * Why is Visual Analytics Important MODULE 2: GET FAMILIAR * What is possible * How does Tableau deal with data * Know your way around * How do we format charts * Dashboard Basics – My First Dashboard MODULE 3: DATA DISCOVERY * Connecting to and setting up data in Tableau * How Do I Explore my Data – Filters & Sorting * How Do I Structure my Data – Groups & Hierarchies, Visual Groups * How Tableau Deals with Dates – Using Discrete and Continuous Dates, Custom Dates PHASE 2: GET SET MODULE 4: MAKE CALCULATIONS * How Do I Create Calculated Fields & Why MODULE 5: MAKE CHARTS * Charts that Compare Multiple Measures – Measure Names and Measure Values, Shared Axis Charts, Dual Axis Charts, Scatter Plots * Showing Relational & Proportional Data – Pie Charts, Donut Charts, Tree Maps MODULE 6: MAKE TABLES * Creating Tables – Creating Tables, Highlight Tables, Heat Maps PHASE 3: GO MODULE 7: ADD CONTEXT * Reference Lines and Bands MODULE 8: MAKE MAPS * Answering Spatial Questions – Mapping, Creating a Choropleth (Filled) Map MODULE 9: MAKE DASHBOARDS * Using the Dashboard Interface * Dashboard Actions -------------------------------------------------------------------------------- This training course includes over 25 hands-on exercises and quizzes to help participants “learn by doing” and to assist group discussions around real-life use cases. Each attendee receives a login to our extensive training portal which covers the theory, practical applications and use cases, exercises, solutions and quizzes in both written and video format. Students must use their own laptop with an active version of Tableau Desktop 2018.2 (or later) pre-installed. -------------------------------------------------------------------------------- WHAT PEOPLE ARE SAYING ABOUT THIS COURSE “Excellent Trainer – knows his stuff, has done it all in the real world, not just the class room.” Richard L., Intelliflo “Tableau is a complicated and powerful tool. After taking this course, I am confident in what I can do, and how it can help improve my work.” Trevor B., Morrison Utility Services “I would highly recommend this course for Tableau beginners, really easy to follow and keep up with as you are hands on during the course. Trainer really helpful too.” Chelsey H., QVC “He is a natural trainer, patient and very good at explaining in simple terms. He has an excellent knowledge base of the system and an obvious enthusiasm for Tableau, data analysis and the best way to convey results. We had been having difficulties in the business in building financial reports from a data cube and he had solutions for these which have proved to be very useful.” Matthew H., ISS Group
Power BI Introduction
By Underscore Group
Learn how to use this powerful tool to import and clean data and create some amazing visuals. -------------------------------------------------------------------------------- COURSE OVERVIEW Duration: 2 days (13 hours) Power BI Desktop is a powerful tool for working with your data. It enables you to import multiple data sources and create effective visualisations and reports. This course is an introduction to Power BI to get you started on creating a powerful reporting capability. You should have a good working knowledge of Excel and managing data before attending. OBJECTIVES By the end of the course you will be able to: * Import data from multiple data sources * Edit and transform data before importing * Create reports * Create different visualisations * Create data models * Build data relationships * Use the drill down features * Create measures * Use the Power BI Service * Build dashboards * Use the mobile app CONTENT ESSENTIALS Importing Data * Power BI Overview * Data sources * Importing data Transforming Your Data * Editing your data * Setting data types * Removing columns/rows * Choosing columns to keep * Setting header rows * Splitting columns Creating Reports * Creating and saving reports * Adding pages * Renaming pages * Interactivity * Refreshing your data Adding Columns * Columns from example * Custom columns * Conditional columns Append Queries * Importing folders * Setting up and using append queries Creating Chart Visualisations * Adding chart elements * Choosing chart types * Setting properties * Setting values, axis and legends * Using tooltips * Visual filters * Setting page and report filters Creating Tables, Cards, Gauges and Maps * Adding table elements * Adding maps * Working with cards * Working with matrices * KPIs and Gauges Conditional Formatting * Setting rules * Removing conditional formatting WORKING WITH DATA MODELS Merge Queries * Setting up and using merge queries * Merging in columns of data Creating a Data Model * The data model * Multiple data tables * Connecting tables * Building relationships * Relationship types * Building visuals from multiple tables Unpivoting Data * Working with summary data * Unpivoting data Using Hierarchies * Using built in hierarchies * Drill down * Drill up * See next level * Expand a hierarchy * Create a new hierarchy Grouping * Grouping text fields * Grouping date and number fields Creating Measures * DAX functions * DAX syntax * Creating a new measure * Using quick measures Using the PowerBI Service * Shared workspaces * My workspace * Dashboards * Reports * Datasets * Drill down in dashboards * Focus mode * Using Q&A * Refreshing data * Using Quick Insights Power BI Mobile App * Using the Power BI Mobile App
Power BI - introduction (2 day) (In-House)
By The In House Training Company
There is a lot to learn in Power BI, this course takes a comprehensive look at the fundamentals of analysing data and includes a balanced look at the four main components that make up Power BI Desktop: Report view, Data view, Model view, and the Power Query Editor. It also demonstrates how to utilise the online Power BI service. It looks at authoring tools that enable you to connect to and transform data from a variety of sources, allowing you to produce detailed reports through a range of visualisations, in an interactive and dynamic way. It also includes a detailed look at formulas by writing both M functions in Power Query, and DAX functions in Desktop view. This knowledge will allow you to take your reports to the next level. The aim of this course is to provide a complete introduction to understanding the Power BI analysis process, by working hands-on with examples that will equip you with the necessary skills to start applying your learning straight away. 1 GETTING STARTED * The Power BI ecosystem * Opening Power BI Desktop * Power BI's four views * Introduction to Dashboards 2 IMPORTING FILES * Importing data sources * Importing an Excel file * Importing a CSV file * Importing a database * Connect to an SQL Server Database * Import vs. Direct Query * Importing from the web * Importing a folder of files * Managing file connections 3 SHAPE DATA IN THE QUERY EDITOR * The process of shaping data * Managing data types * Keeping and removing rows * Add a custom column * Appending tables together * Hiding queries in reports * Fixing error issues * Basic maths operations 4 THE DATA MODEL * Table relationships * Relationship properties 5 MERGE QUERIES * Table join kinds * Merging tables 6 INSERTING DASHBOARD VISUALS * Things to keep in mind * Inserting maps * Formatting Maps * Inserting charts * Formatting Charts * Inserting a tree map * Inserting a table, matrix, and card * Controlling number formats * About report themes * Highlighting key points * Filter reports with slicers * Sync slicers across dashboards * Custom web visuals 7 PUBLISH AND SHARE REPORTS * Publishing to Power BI service * Editing online reports * Pinning visuals to a dashboard * What is Q&A? * Sharing dashboards * Exporting reports to PowerPoint * Exporting reports as PDF files 8 THE POWER QUERY EDITOR * Fill data up and down * Split column by delimiter * Add a conditional column * More custom columns * Merging columns 9 THE M FUNCTIONS * Inserting text functions * Insert an IF function * Create a query group 10 PIVOTING TABLES * Pivot a table * Pivot and append tables * Pivot but don't aggregate * Unpivot tables * Append mismatched headers 11 DATA MODELLING EXPANDED * Understanding relationships * Mark a date table 12 DAX NEW COLUMNS * New columns and measures * New column calculations * Insert a SWITCH function 13 INTRODUCTION TO DAX MEASURES * Common measure functions * Insert a SUM function * Insert a COUNTROWS function * Insert a DISTINCTCOUNT function * Insert a DIVIDE function * DAX rules 14 THE CALCULATE MEASURE * The syntax of CALCULATE * Insert a CALCULATE function * Control field summarisation * Things of note 15 THE SUMX MEASURE * X iterator functions * Anatomy of SUMX * Insert a SUMX function * When to use X functions 16 TIME INTELLIGENCE MEASURES * Importance of a calendar table * Insert a TOTALYTD function * Change financial year end date * Comparing historical data * Insert a DATEADD function 17 HIERARCHIES AND GROUPS * Mine data using hierarchies * Compare data in groups