12 Courses in Glasgow
Get a 10% discount on your first order when you use this promo code at checkout: MAY24BAN3X
OVERVIEW -------------------------------------------------------------------------------- Data and visual analytics are emerging fields concerned with analysing, modelling, and visualizing complex high-dimensional data. It can be analysed and visualised with many languages like Python, R Programming and more. This course will help to attain the skills and give in-depth knowledge to the participant's enhanced way of modelling, analysing and visualizing techniques. The course will highlight practical challenges including composite real-world data and will also comprise several practical studies

ADVANCED KIBANA TRAINING COURSE DESCRIPTION This training course is aimed at users who already have some experience with Kibana, who are looking to further their knowledge. WHAT WILL YOU LEARN * Lens * Timelion * Maps * Custom Visualisations with Vega * Canvas * Filters and Controls * Drilldown and Dashboards * KQSL and ElasticQueries * Scripted and RunTime Fields * Alerts and Alarms ADVANCED KIBANA TRAINING COURSE DETAILS * Who will benefit: Users who already have some experience with Kibana, who are looking to further their knowledge. * Prerequisites: None * Duration 1 day ADVANCED KIBANA TRAINING COURSE CONTENTS Topics * Lens Visualisation types (tables,bars,charts) Category breakdown Adding multiple metrics Using formulas in metrics Labels Adding reference layer Limitations * Visualise Library Timeseries, Metrics Different types of aggregations * Maps GeoMapping Heat Maps Using ES index as data source Visualisation, tool tips * Custom Visualisations with Vega Introduction to vega scripting * Canvas Widgets and Texts Elasticsearch SQL Canvas Expressions * Filters and Controls Dropdown filters Ad-hoc filters Searchbar filters * Drilldown Dashboards Linking one dashboard to another * KQSL and ElasticQueries Bool Query AND/OR Phrase Part match vs keyword search Wildcard search * Scripted and RunTime Fields Creating ad-hoc calculated fields using scripts Performance issues * Alerts and Alarms Query Based Formatting output Connector types(email,index,teams etc)

Front End Loading in Oil and Gas Projects
By Asia Edge
ABOUT THIS TRAINING Front End Loading (FEL) is a methodology that takes a deliberate approach to capital project planning. Where traditional project plans seek to help an operator reach production targets and budgets, FEL methodology aligns an operator's technical and business goals to create a more comprehensive development plan. The FEL approach increases project definition and lowers risk to positively impact total investment costs and return on investment. Training Objectives Upon completion of this course, participants will be able to: * Learn the methods applied for Pre-FEL and FEL process * Understand the importance of FEL, FEL stages; visualisation, conceptualisation, definition * Uncover how to apply project management during FEL * Determine risk management in the FEL process * Understand benchmarking & value improving practices Target Audience The course is recommended for anyone who wish to gain in-depth knowledge and understanding of the importance of Front-End Loading and how to apply Front End Loading best practices, including: * Team Leaders * Senior Managers (Line and Function) * Project Managers * Development Engineers * Graduate Engineers * Quality Assurance Engineers * Key Contractor's Management * FEED engineers * Design engineers * Mechanical engineers * Process engineers Course Level * Basic or Foundation Trainer Your expert course leader is a subsea pipeline consultant with extensive experience in the design, construction, and installation of subsea pipelines for the oil and gas industry. As a consultant, he provides technical expertise and support to clients on all aspects of subsea pipeline projects, from the initial planning and design phase through to construction and commissioning. He is knowledgeable about industry standards, regulations, and best practices for subsea pipelines, and works closely with clients to ensure that projects are delivered safely, on time, and within budget. He has over thirty years' experience in early concept and front-end studies for the initiation of numerous high value upstream oil and gas projects worldwide. He has worked for both Operating Companies and Consultants managing the FEL process for complex, multi-discipline and technically challenging concepts, combining both his technical and project management skills. He has been working with companies like ExxonMobil, Quantum Power, North Caspian Operating Company, OMV Petrom, Port Meridian, BG Group, and etc. POST TRAINING COACHING SUPPORT (OPTIONAL) To further optimise your learning experience from our courses, we also offer individualized 'One to One' coaching support for 2 hours post training. We can help improve your competence in your chosen area of interest, based on your learning needs and available hours. This is a great opportunity to improve your capability and confidence in a particular area of expertise. It will be delivered over a secure video conference call by one of our senior trainers. They will work with you to create a tailor-made coaching program that will help you achieve your goals faster. Request for further information post training support and fees applicable Accreditions And Affliations

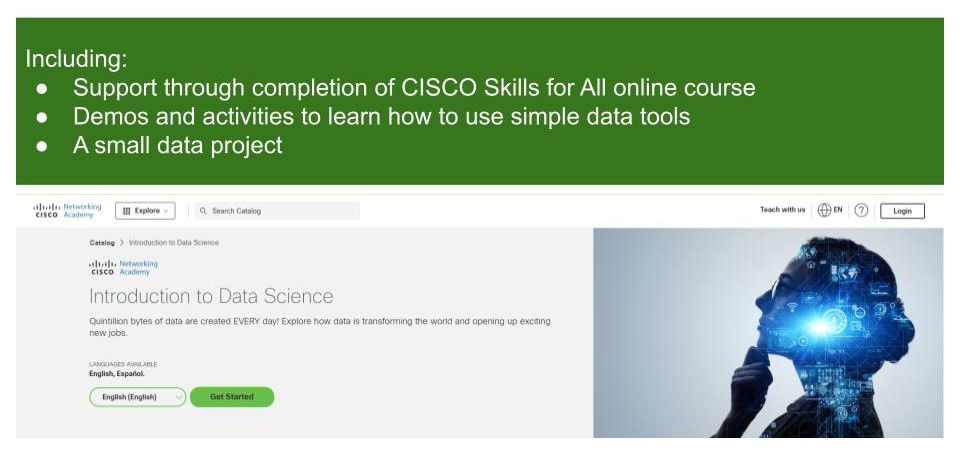
Introduction to Data Science
By futureCoders SE
Learn the basics of Data Science, combining a supported #CISCO Skills for All online course with practical learning and a project to help consolidate the learning.
Power BI - dashboards (1 day) (In-House)
By The In House Training Company
Power BI is a powerful data visualisation program that allows businesses to monitor data, analyse trends, and make decisions. This course is designed to provide a solid understanding of the reporting side of Power BI, the dashboards, where administrators, and end users can interact with dynamic visuals that communicates information. This course focuses entirely on the creation and design of visualisations in dashboards, including a range of chart types, engaging maps, and different types of tables. Designing dashboards with KPI's (key performance indicators), heatmaps, flowcharts, sparklines, and compare multiple variables with trendlines. This one-day programme focuses entirely on creating dashboards, by using the many visualisation tools available in Power BI. You will learn to build dynamic, user-friendly interfaces in both Power BI Desktop and Power BI Service. 1 INTRODUCTION * Power BI ecosystem * Things to keep in mind * Selecting dashboard colours * Importing visuals into Power BI * Data sources for your analysis * Joining tables in Power BI 2 WORKING WITH DATA * Utilising a report theme * Table visuals * Matrix visuals * Drilling into hierarchies * Applying static filters * Group numbers with lists * Group numbers with bins 3 CREATING VISUALS * Heatmaps in Power BI * Visualising time-intelligence trends * Ranking categorical totals * Comparing proportions * View trends with sparklines 4 COMPARING VARIABLES * Insert key performance indicators (KPI) * Visualising trendlines as KPI * Forecasting with trendlines * Visualising flows with Sankey diagrams * Creating a scatter plot 5 MAPPING OPTIONS * Map visuals * Using a filled map * Mapping with latitude and longitude * Mapping with ArcGIS or ESRI 6 CREATING DASHBOARDS * High-level dashboard * Migration analysis dashboard * Adding slicers for filtering * Promote interaction with nudge prompts * Searching the dashboard with a slicer * Creating dynamic labels * Highlighting key points on the dashboard * Customised visualisation tooltips * Syncing slicers across pages 7 SHARING DASHBOARDS * Setting up and formatting phone views * Exporting data * Creating PDF files * Uploading to the cloud * Share dashboards in SharePoint online

Visual Analytics Best Practice
By Tableau Training Uk
This course is very much a discussion, so be prepared to present and critically analyse your own and class mates work. You will also need to bring a few examples of work you have done in the past. Learning and applying best practice visualisation principles will improve effective discussions amongst decision makers throughout your organisation. As a result more end-users of your dashboards will be able to make better decisions, more quickly. This 2 Day training course is aimed at analysts with good working knowledge of BI tools (we use Tableau to present, but attendees can use their own software such as Power BI or Qlik Sense). It is a great preparation for taking advanced certifications, such as Tableau Certified Professional. -------------------------------------------------------------------------------- Contact us to discuss the Visual Analytics Best Practice course Email us if you are interested in an on-site course, or would be interested in different dates and locations -------------------------------------------------------------------------------- This Tableau Desktop training intermediate course is designed for the professional who has a solid foundation with Tableau and is looking to take it to the next level. Attendees should have a good understanding of the fundamental concepts of building Tableau worksheets and dashboards typically achieved from having attended our Tableau Desktop Foundation Course. At the end of this course you will be able to communicate insights more effectively, enabling your organisation to make better decisions, quickly. The Tableau Desktop Analyst training course is aimed at people who are used to working with MS Excel or other Business Intelligence tools and who have preferably been using Tableau already for basic reporting. -------------------------------------------------------------------------------- THE COURSE INCLUDES THE FOLLOWING TOPICS: WHAT IS VISUAL ANALYSIS? * Visual Analytics * Visual Analytics Process * Advantages of Visual Analysis * Exercise: Interpreting Visualisations HOW DO WE PROCESS VISUAL INFORMATION? * Memory and Processing Types * Exercise: Identifying Types of Processing * Cognitive Load * Exercise: Analysing Cognitive Load * Focus and Guide the Viewer * Remove Visual Distractions * Organise Information into Chunks * Design for Proximity * Exercise: Reducing Cognitive Load SENSORY MEMORY * Pre-attentive Attributes * Quantitatively-Perceived Attributes * Categorically-Perceived Attributes * Exercise: Analysing Pre-attentive Attributes * Form & Attributes * Exercise: Using Form Effectively * Colour & Attributes * Exercise: Using Colour Effectively * Position & Attributes * Exercise: Using Position Effectively ENSURING VISUAL INTEGRITY * Informing without Misleading * Gestalt Principles * Visual Area * Axis & Scale * Colour * Detail * Exercise: Informing without Misleading CHOOSING THE RIGHT VISUALISATION * Comparing and Ranking Categories * Comparing Measures * Comparing Parts to Whole * Viewing Data Over Time * Charts Types for Mapping * Viewing Correlation * Viewing Distributions * Viewing Specific Values DASHBOARDS AND STORIES * Exercise: Picking the Chart Type * Exercise: Brainstorming Visual Best Practice * Development Process for Dashboards and Stories * Plan the Visualisation * Create the Visualisation * Test the Visualisation * Exercise: Designing Dashboards and Stories -------------------------------------------------------------------------------- This training course includes over 20 hands-on exercises to help participants “learn by doing” and to assist group discussions around real-life use cases. Each attendee receives an extensive training manual which covers the theory, practical applications and use cases, exercises and solutions together with a USB with all the materials required for the training. The course starts at 09:30 on the first day and ends at 17:00. On the second day the course starts at 09:00 and ends at 17:00. Students must bring their own laptop with an active version of Tableau Desktop 10.5 (or later) pre-installed. -------------------------------------------------------------------------------- WHAT PEOPLE ARE SAYING ABOUT THIS COURSE "Steve was willing to address questions arising from his content in a full and understandable way" Lisa L. "Really enjoyed the course and feel the subject and the way it was taught was very close to my needs" James G. "The course tutor Steve was incredibly helpful and taught the information very well while making the two days very enjoyable." Bradd P. "The host and his courses will give you the tools and confidence that you need to be comfortable with Tableau." Jack S. "Steve was fantastic with his knowledge and knowhow about the product. Where possible he made sure you could put demonstrations in to working practice, to give the audience a clear understanding." Tim H. "This was a very interesting and helpful course, which will definitely help me produce smarter, cleaner visualisations that will deliver more data-driven insights within our business." Richard A. "Steve is very open to questions and will go out of his way to answer any query. Thank you" Wasif N. "Steve was willing to address questions arising from his content in a full and understandable way" Lisa L. "Really enjoyed the course and feel the subject and the way it was taught was very close to my needs" James G.

Power BI - advanced (1 day) (In-House)
By The In House Training Company
This course starts with data transformation strategies, exploring capabilities in the Power Query Editor, and data-cleansing practices. It looks at the Advanced Query Editor to view the M language code. This course focuses on advanced DAX measures that include filtering conditions, with a deep dive into time intelligence measures. Like the M query language, DAX is a rich functional language that supports variables and expression references. This course also looks at the creation of dynamic dashboards and incorporates a range of visualisations available in Power BI Desktop and online in the AppSource. The course finishes with a look at setting up end user level security in tables. 1 THE QUERY EDITOR * Split by row delimiter * AddDays to determine deadlines * Advanced query editor 2 FUZZY MATCHING JOINS * Matching inconsistencies by percentage * Matching with transformation table 3 LOGICAL COLUMN FUNCTIONS * Logical functions IF, AND, OR * Using multiple conditions * Including FIND in functions 4 EDITING DAX MEASURES * Make DAX easier to read * Add comments to a measure * Using quick measures 5 THE ANATOMY OF CALCULATE * Understanding CALCULATE context filters * Adding context to CALCULATE with FILTER * Using CALCULATE with a threshold 6 THE ALL MEASURE * Anatomy of ALL * Create an ALL measure * Using ALL as a filter * Use ALL for percentage 7 DAX ITERATORS * Anatomy of iterators * A closer look at SUMX * Using RELATED in SUMX * Create a RANKX * RANKX with ALL 8 DATE AND TIME FUNCTIONS * Overview of functions * Create a DATEDIFF function 9 TIME INTELLIGENT MEASURES * Compare historical monthly data * Create a DATEADD measure * Creating cumulative totals * Creating cumulative measures * Visualising cumulative totals 10 VISUALISATIONS IN-DEPTH * Utilising report themes * Create a heatmap * Comparing proportions * View trends with sparklines * Group numbers using bins * Setting up a histogram 11 COMPARING VARIABLES * Visualising trendlines as KPI * Forecasting with trendlines * Creating a scatter plot * Creating dynamic labels * Customised visualisation tooltips * Export reports to SharePoint 12 USER LEVEL SECURITY * Setting up row level security * Testing user security
Power BI - intermediate (2 day) (In-House)
By The In House Training Company
This course is designed for those already using Power BI Desktop and are ready to work with more comprehensive elements of analysing and reporting in Power BI. The course maintains a balanced look at data analysis including the Power Query Editor, with a deep dive into writing DAX formulas, and enhanced dashboard visualisations. The aim of this course is to provide a more complete understanding of the whole Power BI analytics process, by working with business examples that will equip you with the necessary skills to output comprehensive reports and explore Power BI's analytical capabilities in more depth. 1 THE QUERY EDITOR * Grouping rows in a table * Split row by delimiter * Add days to determine deadlines * The query editor 2 FUZZY MATCHING JOINS * Matching inconsistencies by percentage * Matching with transformation table 3 THE QUERY EDITOR M FUNCTIONS * Adding custom columns * Creating an IF function * Nested AND logics in an IF function 4 DAX NEW COLUMNS FUNCTIONS * Including TRUE with SWITCH * Using multiple conditions * The FIND DAX function * The IF DAX function * Logical functions IF, AND, OR 5 EDITING DAX MEASURES * Making DAX easier to read * Add comments to a measure * Using quick measures 6 THE ANATOMY OF CALCULATE * Understanding CALCULATE filters * Add context to CALCULATE with FILTER * Using CALCULATE with a threshold 7 THE ALL MEASURE * Anatomy of ALL * Create an ALL measure * Using ALL as a filter * Use ALL for percentages 8 DAX ITERATORS * Anatomy of iterators * A closer look at SUMX * Using RELATED with SUMX * Create a RANKX * RANKX with ALL 9 DATE AND TIME FUNCTIONS * Overview of functions * Create a DATEDIFF function 10 TIME INTELLIGENT MEASURES * Compare historical monthly data * Create a DATEADD measure * Creating cumulative totals * Creating cumulative measures * Visualising cumulative totals 11 VISUALISATIONS IN-DEPTH * Utilising report themes * Applying static filters * Group data using lists * Group numbers using bins * Creating heatmaps * Comparing proportions * View trends with sparklines 12 COMPARING VARIABLES * Visualising trendlines as KPI * Forecasting with trendlines * Creating a scatter plot * Creating dynamic labels * Customised visualisation tooltips * Export reports to SharePoint
Introduction to Data Science - free for Medway residents
By futureCoders SE
Learn the basics of Data Science, combining a supported #CISCO Skills for All online course with practical learning and a project to help consolidate the learning.
Power BI - introduction to intermediate (2 days) (In-House)
By The In House Training Company
This course starts with the basics then moves seamlessly to an intermediate level. It includes a comprehensive yet balanced look at the four main components that make up Power BI Desktop: Report view, Data view, Model view, and the Power Query Editor. It also demonstrates how to use the online Power BI service. It looks at authoring tools that enables you to connect to and transform data from a variety of sources, allowing you to produce dynamic reports using a library of visualisations. Once you have those reports, the course looks at the seamless process of sharing those with your colleagues by publishing to the online Power BI service. The aim of this course is to provide a strong understanding of the Power BI analysis process, by working with real-world examples that will equip you with the necessary skills to start applying your knowledge straight away. 1 GETTING STARTED * The Power BI process * Launching Power BI Desktop * The four views of Power BI * Dashboard visuals 2 CONNECTING TO FILES * Connect to data sources * Connect to an Excel file * Connect to a CSV file * Connect to a database * Import vs. DirectQuery * Connect to a web source * Create a data table 3 TRANSFORMING DATA * The process of cleaning data * Column data types * Remove rows with filters * Add a custom column * Append data to a table * Fix error issues * Basic maths operations 4 BUILD A DATA MODEL * Table relationships * Manage table relationships 5 MERGE QUERIES * Table join kinds * Merging tables 6 CREATE REPORT VISUALISATIONS * Creating map visuals * Formatting maps * Creating chart visuals * Formatting chart * Tables, matrixes, and cards * Control formatting with themes * Filter reports with slicers * Reports for mobile devices * Custom online visuals * Export report data to Excel 7 THE POWER QUERY EDITOR * Fill data up and down * Split columns by delimiter * Add conditional columns * Merging columns 8 THE M FORMULA * Creating M functions * Create an IF function * Create a query group 9 PIVOT AND UNPIVOT TABLES * Pivot tables in the query editor * Pivot and append tables * Pivot but don't summarise * Unpivot tables * Append mismatched headers 10 DATA MODELLING REVISITED * Data model relationships * Mark a calendar as a date table 11 INTRODUCTION TO CALCULATED COLUMNS * New columns vs. measures * Creating a new column calculation * The SWITCH function 12 INTRODUCTION TO DAX MEASURES * Common measure categories * The SUM measure * Adding measures to visuals * COUNTROWS and DISINCTCOUNT functions * DAX rules 13 THE CALCULATE MEASURE * The syntax of CALCULATE * Things of note about CALCULATE 14 THE SUMX MEASURE * The SUMX measure * X iterator functions * Anatomy of SUMX 15 INTRODUCTION TO TIME INTELLIGENCE * Importance of a calendar table * A special lookup table * The TOTALYTD measure * Change year end in TOTALYTD 16 HIERARCHY, GROUPS AND FORMATTING * Create a hierarchy to drill data * Compare data in groups * Add conditional formatting 17 SHARE REPORTS ON THE WEB * Publish to the BI online service * Get quick insights * Upload reports from BI service * Exporting report data * What is Q&A? * Sharing your reports 18 APPLY YOUR LEARNING * Post training recap lesson