Educators providing Tableau Desktop Specialist courses in Nottingham
We couldn't find any listings for your search.
Know someone teaching this? Help them become an Educator on Cademy.
Courses matching "Tableau Desktop Specialist"
Show all 4Tableau Desktop Training - Analyst
By Tableau Training Uk
This Tableau Desktop Training intermediate course is designed for the professional who has a solid foundation with Tableau and is looking to take it to the next level. -------------------------------------------------------------------------------- For Private options, online or in-person, please send us details of your requirements: -------------------------------------------------------------------------------- This Tableau Desktop training intermediate course is designed for the professional who has a solid foundation with Tableau and is looking to take it to the next level. Attendees should have a good understanding of the fundamental concepts of building Tableau worksheets and dashboards typically achieved from having attended our Tableau Desktop Foundation Course. At the end of this course you will be able to communicate insights more effectively, enabling your organisation to make better decisions, quickly. The Tableau Desktop Analyst training course is aimed at people who are used to working with MS Excel or other Business Intelligence tools and who have preferably been using Tableau already for basic reporting. -------------------------------------------------------------------------------- THE COURSE IS SPLIT INTO 3 PHASES AND 9 MODULES: PHASE 1: AMPLIFY MODULE 1: CHECK ABILITIES * Revision – What I Should Know * * What is possible * How does Tableau deal with data * Know your way around * How do we format charts * How Tableau deals with dates * Charts that compare multiple measures * Creating Tables MODULE 2: COMBINE DATA * Relationships * Joining Tables – Join Types, Joining tables within the same database, cross database joins, join calculations * Blending – How to create a blend with common fields, Custom defined Field relationships and mismatched element names, Calculated fields in blended data sources * Unions – Manual Unions and mismatched columns, Wildcard unions * Data Extracts – Creating & Editing Data extracts MODULE 3: ADVANCED CALCULATIONS * Row Level v Aggregations * Aggregating dimensions in calculations * Changing the Level of Detail (LOD) of calculations – What, Why, How * Adding Table Calculations PHASE 2: ANALYSE MODULE 4: EXPAND APPLICATION * Making things dynamic with parameters * Sets * Trend Lines * How do we format charts * Forecasting MODULE 5: ADVANCED MAPPING * Using your own images for spatial analysis * Mapping with Spatial files MODULE 6: DATA COMPARISONS Advanced Charts * Bar in Bar charts * Bullet graphs * Creating Bins and Histograms * Creating a Box & Whisker plot PHASE 3: ACT MODULE 7: ADVANCED DASHBOARDS * Using the dashboard interface and Device layout * Dashboard Actions and Viz In tooltips * Horizontal & Vertical containers * Navigate between dashboards MODULE 8: PRESENT STORIES * Telling data driven stories MODULE 9: ENABLE DECISIONS * What is Tableau Server * Publishing & Permissions * How can your users engage with content -------------------------------------------------------------------------------- This training course includes over 25 hands-on exercises and quizzes to help participants “learn by doing” and to assist group discussions around real-life use cases. Each attendee receives a login to our extensive training portal which covers the theory, practical applications and use cases, exercises, solutions and quizzes in both written and video format. Students must bring their own laptop with an active version of Tableau Desktop 2018.2 (or later) pre-installed. -------------------------------------------------------------------------------- WHAT PEOPLE ARE SAYING ABOUT THIS COURSE “Course was fantastic, and completely relevant to the work I am doing with Tableau. I particularly liked Steve’s method of teaching and how he applied the course material to ‘real-life’ use-cases.” Richard W., Dashboard Consulting Ltd “This course was extremely useful and excellent value. It helped me formalise my learning and I have taken a lot of useful tips away which will help me in everyday work.” Lauren M., Baillie Gifford “I would definitely recommend taking this course if you have a working knowledge of Tableau. Even the little tips Steve explains will make using Tableau a lot easier. Looking forward to putting what I’ve learned into practice.” Aron F., Grove & Dean “Steve is an excellent teacher and has a vast knowledge of Tableau. I learned a huge amount over the two days that I can immediately apply at work.” John B., Mporium “Steve not only provided a comprehensive explanation of the content of the course, but also allowed time for discussing particular business issues that participants may be facing. That was really useful as part of my learning process.” Juan C., Financial Conduct Authority “Course was fantastic, and completely relevant to the work I am doing with Tableau. I particularly liked Steve’s method of teaching and how he applied the course material to ‘real-life’ use-cases.” Richard W., Dashboard Consulting Ltd “This course was extremely useful and excellent value. It helped me formalise my learning and I have taken a lot of useful tips away which will help me in everyday work.” Lauren M., Baillie Gifford “I would definitely recommend taking this course if you have a working knowledge of Tableau. Even the little tips Steve explains will make using Tableau a lot easier. Looking forward to putting what I’ve learned into practice.” Aron F., Grove & Dean “Steve is an excellent teacher and has a vast knowledge of Tableau. I learned a huge amount over the two days that I can immediately apply at work.” John B., Mporium
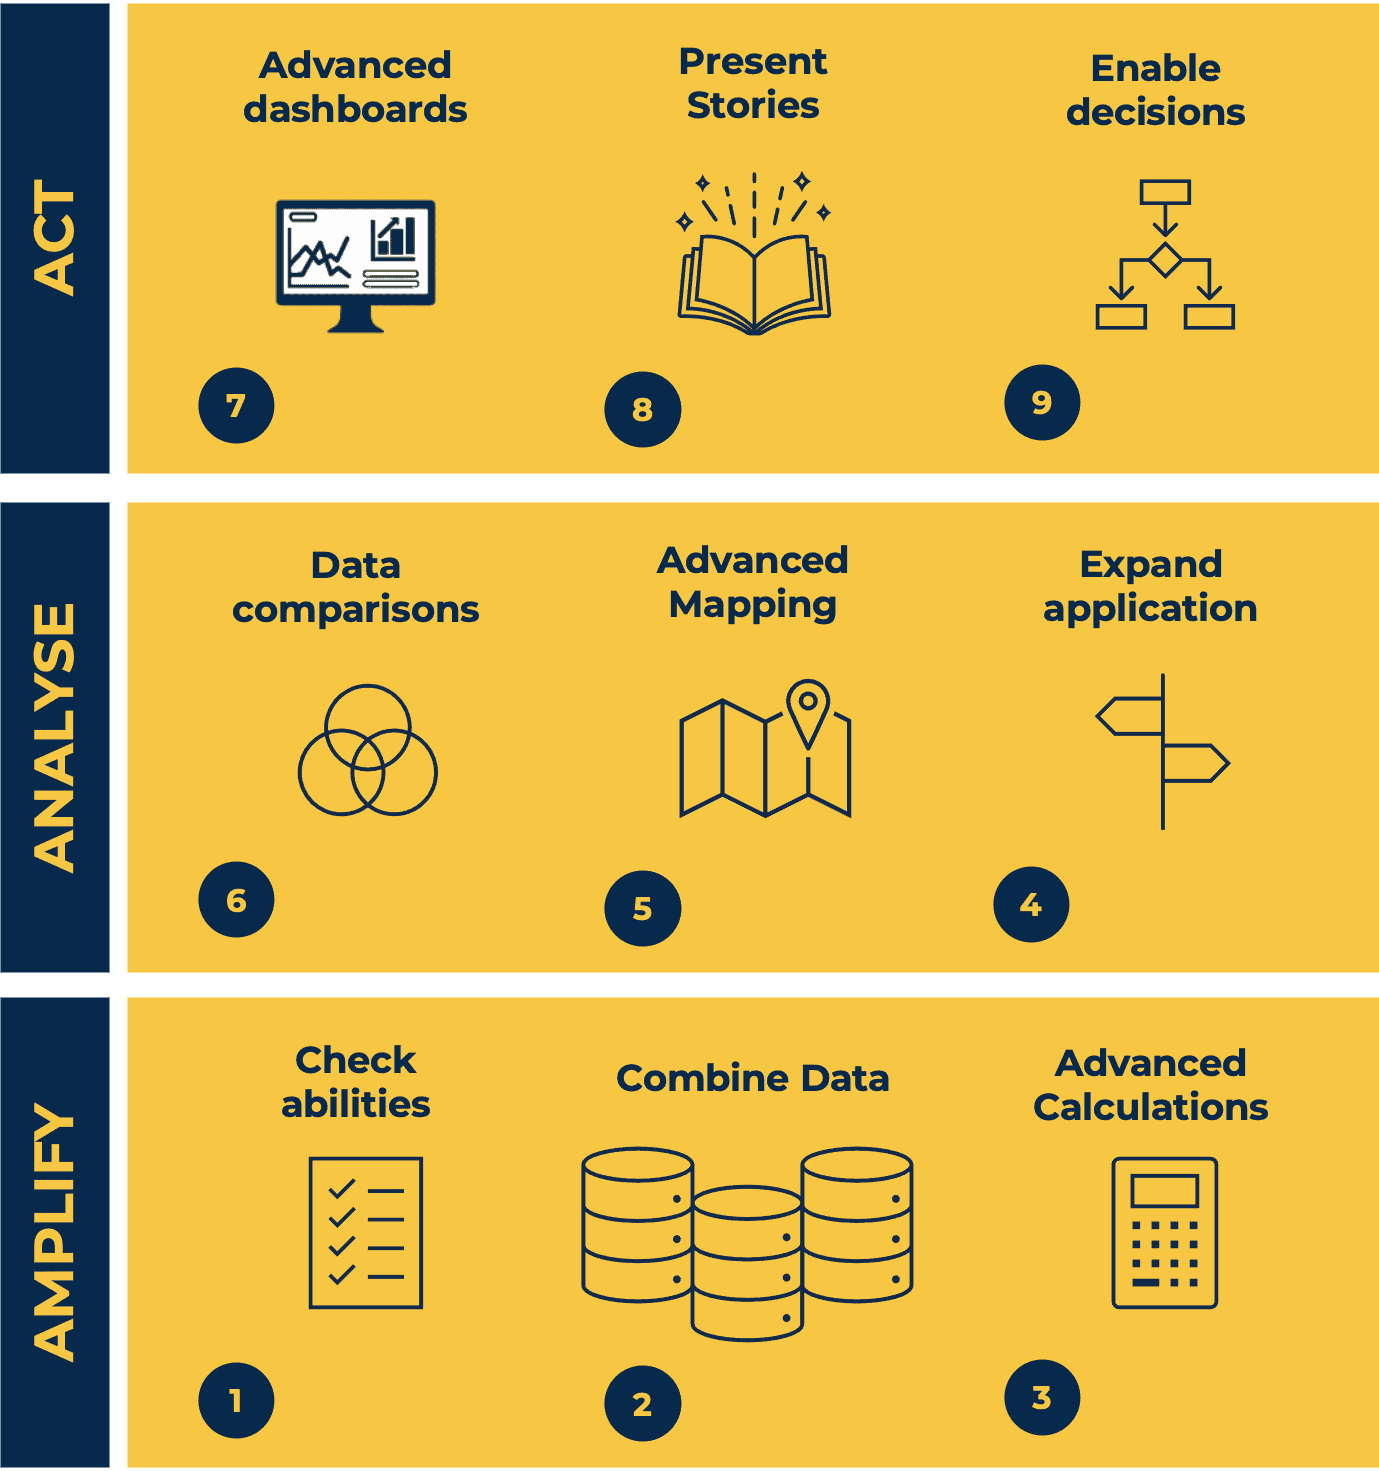
Tableau Desktop Training - Foundation
By Tableau Training Uk
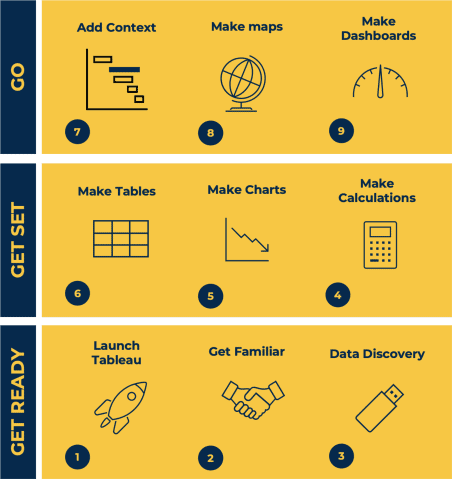
This Tableau Desktop Training course is a jumpstart to getting report writers and analysts with little or no previous knowledge to being productive. It covers everything from connecting to data, through to creating interactive dashboards with a range of visualisations in two days of your time. -------------------------------------------------------------------------------- For Private options, online or in-person, please send us details of your requirements: -------------------------------------------------------------------------------- This Tableau Desktop Training course is a jumpstart to getting report writers and analysts with little or no previous knowledge to being productive. It covers everything from connecting to data, through to creating interactive dashboards with a range of visualisations in two days of your time. Having a quick turnaround from starting to use Tableau, to getting real, actionable insights means that you get a swift return on your investment of time and money. This accelerated approach is key to getting engagement from within your organisation so everyone can immediately see and feel the impact of the data and insights you create. This course is aimed at someone who has not used Tableau in earnest and may be in a functional role, eg. in sales, marketing, finance, operations, business intelligence etc. -------------------------------------------------------------------------------- THE COURSE IS SPLIT INTO 3 PHASES AND 9 MODULES: PHASE 1: GET READY MODULE 1: LAUNCH TABLEAU * Check Install & Setup * Why is Visual Analytics Important MODULE 2: GET FAMILIAR * What is possible * How does Tableau deal with data * Know your way around * How do we format charts * Dashboard Basics – My First Dashboard MODULE 3: DATA DISCOVERY * Connecting to and setting up data in Tableau * How Do I Explore my Data – Filters & Sorting * How Do I Structure my Data – Groups & Hierarchies, Visual Groups * How Tableau Deals with Dates – Using Discrete and Continuous Dates, Custom Dates PHASE 2: GET SET MODULE 4: MAKE CALCULATIONS * How Do I Create Calculated Fields & Why MODULE 5: MAKE CHARTS * Charts that Compare Multiple Measures – Measure Names and Measure Values, Shared Axis Charts, Dual Axis Charts, Scatter Plots * Showing Relational & Proportional Data – Pie Charts, Donut Charts, Tree Maps MODULE 6: MAKE TABLES * Creating Tables – Creating Tables, Highlight Tables, Heat Maps PHASE 3: GO MODULE 7: ADD CONTEXT * Reference Lines and Bands MODULE 8: MAKE MAPS * Answering Spatial Questions – Mapping, Creating a Choropleth (Filled) Map MODULE 9: MAKE DASHBOARDS * Using the Dashboard Interface * Dashboard Actions -------------------------------------------------------------------------------- This training course includes over 25 hands-on exercises and quizzes to help participants “learn by doing” and to assist group discussions around real-life use cases. Each attendee receives a login to our extensive training portal which covers the theory, practical applications and use cases, exercises, solutions and quizzes in both written and video format. Students must use their own laptop with an active version of Tableau Desktop 2018.2 (or later) pre-installed. -------------------------------------------------------------------------------- WHAT PEOPLE ARE SAYING ABOUT THIS COURSE “Excellent Trainer – knows his stuff, has done it all in the real world, not just the class room.” Richard L., Intelliflo “Tableau is a complicated and powerful tool. After taking this course, I am confident in what I can do, and how it can help improve my work.” Trevor B., Morrison Utility Services “I would highly recommend this course for Tableau beginners, really easy to follow and keep up with as you are hands on during the course. Trainer really helpful too.” Chelsey H., QVC “He is a natural trainer, patient and very good at explaining in simple terms. He has an excellent knowledge base of the system and an obvious enthusiasm for Tableau, data analysis and the best way to convey results. We had been having difficulties in the business in building financial reports from a data cube and he had solutions for these which have proved to be very useful.” Matthew H., ISS Group
Visual Analytics Best Practice
By Tableau Training Uk
This course is very much a discussion, so be prepared to present and critically analyse your own and class mates work. You will also need to bring a few examples of work you have done in the past. Learning and applying best practice visualisation principles will improve effective discussions amongst decision makers throughout your organisation. As a result more end-users of your dashboards will be able to make better decisions, more quickly. This 2 Day training course is aimed at analysts with good working knowledge of BI tools (we use Tableau to present, but attendees can use their own software such as Power BI or Qlik Sense). It is a great preparation for taking advanced certifications, such as Tableau Certified Professional. -------------------------------------------------------------------------------- Contact us to discuss the Visual Analytics Best Practice course Email us if you are interested in an on-site course, or would be interested in different dates and locations -------------------------------------------------------------------------------- This Tableau Desktop training intermediate course is designed for the professional who has a solid foundation with Tableau and is looking to take it to the next level. Attendees should have a good understanding of the fundamental concepts of building Tableau worksheets and dashboards typically achieved from having attended our Tableau Desktop Foundation Course. At the end of this course you will be able to communicate insights more effectively, enabling your organisation to make better decisions, quickly. The Tableau Desktop Analyst training course is aimed at people who are used to working with MS Excel or other Business Intelligence tools and who have preferably been using Tableau already for basic reporting. -------------------------------------------------------------------------------- THE COURSE INCLUDES THE FOLLOWING TOPICS: WHAT IS VISUAL ANALYSIS? * Visual Analytics * Visual Analytics Process * Advantages of Visual Analysis * Exercise: Interpreting Visualisations HOW DO WE PROCESS VISUAL INFORMATION? * Memory and Processing Types * Exercise: Identifying Types of Processing * Cognitive Load * Exercise: Analysing Cognitive Load * Focus and Guide the Viewer * Remove Visual Distractions * Organise Information into Chunks * Design for Proximity * Exercise: Reducing Cognitive Load SENSORY MEMORY * Pre-attentive Attributes * Quantitatively-Perceived Attributes * Categorically-Perceived Attributes * Exercise: Analysing Pre-attentive Attributes * Form & Attributes * Exercise: Using Form Effectively * Colour & Attributes * Exercise: Using Colour Effectively * Position & Attributes * Exercise: Using Position Effectively ENSURING VISUAL INTEGRITY * Informing without Misleading * Gestalt Principles * Visual Area * Axis & Scale * Colour * Detail * Exercise: Informing without Misleading CHOOSING THE RIGHT VISUALISATION * Comparing and Ranking Categories * Comparing Measures * Comparing Parts to Whole * Viewing Data Over Time * Charts Types for Mapping * Viewing Correlation * Viewing Distributions * Viewing Specific Values DASHBOARDS AND STORIES * Exercise: Picking the Chart Type * Exercise: Brainstorming Visual Best Practice * Development Process for Dashboards and Stories * Plan the Visualisation * Create the Visualisation * Test the Visualisation * Exercise: Designing Dashboards and Stories -------------------------------------------------------------------------------- This training course includes over 20 hands-on exercises to help participants “learn by doing” and to assist group discussions around real-life use cases. Each attendee receives an extensive training manual which covers the theory, practical applications and use cases, exercises and solutions together with a USB with all the materials required for the training. The course starts at 09:30 on the first day and ends at 17:00. On the second day the course starts at 09:00 and ends at 17:00. Students must bring their own laptop with an active version of Tableau Desktop 10.5 (or later) pre-installed. -------------------------------------------------------------------------------- WHAT PEOPLE ARE SAYING ABOUT THIS COURSE "Steve was willing to address questions arising from his content in a full and understandable way" Lisa L. "Really enjoyed the course and feel the subject and the way it was taught was very close to my needs" James G. "The course tutor Steve was incredibly helpful and taught the information very well while making the two days very enjoyable." Bradd P. "The host and his courses will give you the tools and confidence that you need to be comfortable with Tableau." Jack S. "Steve was fantastic with his knowledge and knowhow about the product. Where possible he made sure you could put demonstrations in to working practice, to give the audience a clear understanding." Tim H. "This was a very interesting and helpful course, which will definitely help me produce smarter, cleaner visualisations that will deliver more data-driven insights within our business." Richard A. "Steve is very open to questions and will go out of his way to answer any query. Thank you" Wasif N. "Steve was willing to address questions arising from his content in a full and understandable way" Lisa L. "Really enjoyed the course and feel the subject and the way it was taught was very close to my needs" James G.

Power BI - dashboards (1 day) (In-House)
By The In House Training Company
Power BI is a powerful data visualisation program that allows businesses to monitor data, analyse trends, and make decisions. This course is designed to provide a solid understanding of the reporting side of Power BI, the dashboards, where administrators, and end users can interact with dynamic visuals that communicates information. This course focuses entirely on the creation and design of visualisations in dashboards, including a range of chart types, engaging maps, and different types of tables. Designing dashboards with KPI's (key performance indicators), heatmaps, flowcharts, sparklines, and compare multiple variables with trendlines. This one-day programme focuses entirely on creating dashboards, by using the many visualisation tools available in Power BI. You will learn to build dynamic, user-friendly interfaces in both Power BI Desktop and Power BI Service. 1 INTRODUCTION * Power BI ecosystem * Things to keep in mind * Selecting dashboard colours * Importing visuals into Power BI * Data sources for your analysis * Joining tables in Power BI 2 WORKING WITH DATA * Utilising a report theme * Table visuals * Matrix visuals * Drilling into hierarchies * Applying static filters * Group numbers with lists * Group numbers with bins 3 CREATING VISUALS * Heatmaps in Power BI * Visualising time-intelligence trends * Ranking categorical totals * Comparing proportions * View trends with sparklines 4 COMPARING VARIABLES * Insert key performance indicators (KPI) * Visualising trendlines as KPI * Forecasting with trendlines * Visualising flows with Sankey diagrams * Creating a scatter plot 5 MAPPING OPTIONS * Map visuals * Using a filled map * Mapping with latitude and longitude * Mapping with ArcGIS or ESRI 6 CREATING DASHBOARDS * High-level dashboard * Migration analysis dashboard * Adding slicers for filtering * Promote interaction with nudge prompts * Searching the dashboard with a slicer * Creating dynamic labels * Highlighting key points on the dashboard * Customised visualisation tooltips * Syncing slicers across pages 7 SHARING DASHBOARDS * Setting up and formatting phone views * Exporting data * Creating PDF files * Uploading to the cloud * Share dashboards in SharePoint online