14 Power Query courses delivered Live Online
Get a 10% discount on your first order when you use this promo code at checkout: MAY24BAN3X
Power BI Data Analyst (PL300)
By Online Productivity Training
OVERVIEW This official Microsoft Power BI training course will teach you how to connect to data from many sources, clean and transform it using Power Query, create a data model consisting of multiple tables connected with relationships and build visualisations and reports to show the patterns in the data. The course will explore formulas created using the DAX language, including the use of advanced date intelligence calculations. Additional visualisation features including interactivity between the elements of a report page are covered as well as parameters and row-level security, which allows a report to be tailored according to who is viewing it. The course will also show how to publish reports and dashboards to a workspace on the Power BI Service. COURSE BENEFITS: * Learn how to clean, transform, and load data from many sources * Use database queries in Power Query to combine tables using append and merge * Create and manage a data model in Power BI consisting of multiple tables connected with relationships * Build Measures and other calculations in the DAX language to plot in reports * Manage advanced time calculations using date tables * Optimise report calculations using the Performance Analyzer * Manage and share report assets to the Power BI Service * Prepare for the official Microsoft PL-300 exam using Microsoft Official Courseware WHO IS THE COURSE FOR? * Data Analysts with little or no experience of Power BI who wish to upgrade their knowledge to include Business Intelligence * Management Consultants who need to conduct rapid analysis of their clients’ data to answer specific business questions * Analysts who need to upgrade their organisation from a simple Excel or SQL-based management reporting system to a dynamic BI system * Data Analysts who wish to develop organisation-wide reporting in the form of web reports or phone apps * Marketers in data-intensive organisations who wish to build visually appealing, dynamic charts for their stakeholders to use COURSE OUTLINE Module 1 Getting Started With Microsoft Data Analytics * Data analytics and Microsoft * Getting Started with Power BI Module 2 Get Data In Power BI * Get data from various data sources * Optimize performance * Resolve data errors Lab: Prepare Data in Power BI Desktop Module 3 Clean, Transform And Load Data In Power BI * Data shaping * Data profiling * Enhance the data structure Lab: Load Data in Power BI Desktop Module 4 Design A Data Model In Power BI * Introduction to data modelling * Working with Tables * Dimensions and Hierarchies Lab: Model Data in Power BI Desktop Module 5 Create Model Calculations Using DAX In Power BI * Introduction to DAX * Real-time Dashboards * Advanced DAX Lab 1: Create DAX Calculations in Power BI Desktop, Part 1 Lab 2: Create DAX Calculations in Power BI Desktop, Part 2 Module 6 Optimize Model Performance * Optimize the data model for performance * Optimize DirectQuery models Module 7 Create Reports * Design a Report * Enhance the Report Lab 1: Design a Report in Power BI Desktop, Part 1 Lab 2: Design a Report in Power BI Desktop, Part 2 Module 8 Create Dashboards * Create a Dashboard * Real-time Dashboards * Enhance a Dashboard Lab: Create a Power BI Dashboard Module 9 Perform Advanced Analytics * Advanced analytics * Data Insights through AI Visuals Lab: Perform Data Analysis in Power BI Desktop Module 10 Create And Manage Workspaces * Creating Workspaces * Sharing and managing assets Module 11 Manage Datasets In Power BI * Parameters * Datasets Module 12 Row-Level Security * Security in Power BI Lab: Enforce Row-Level Security
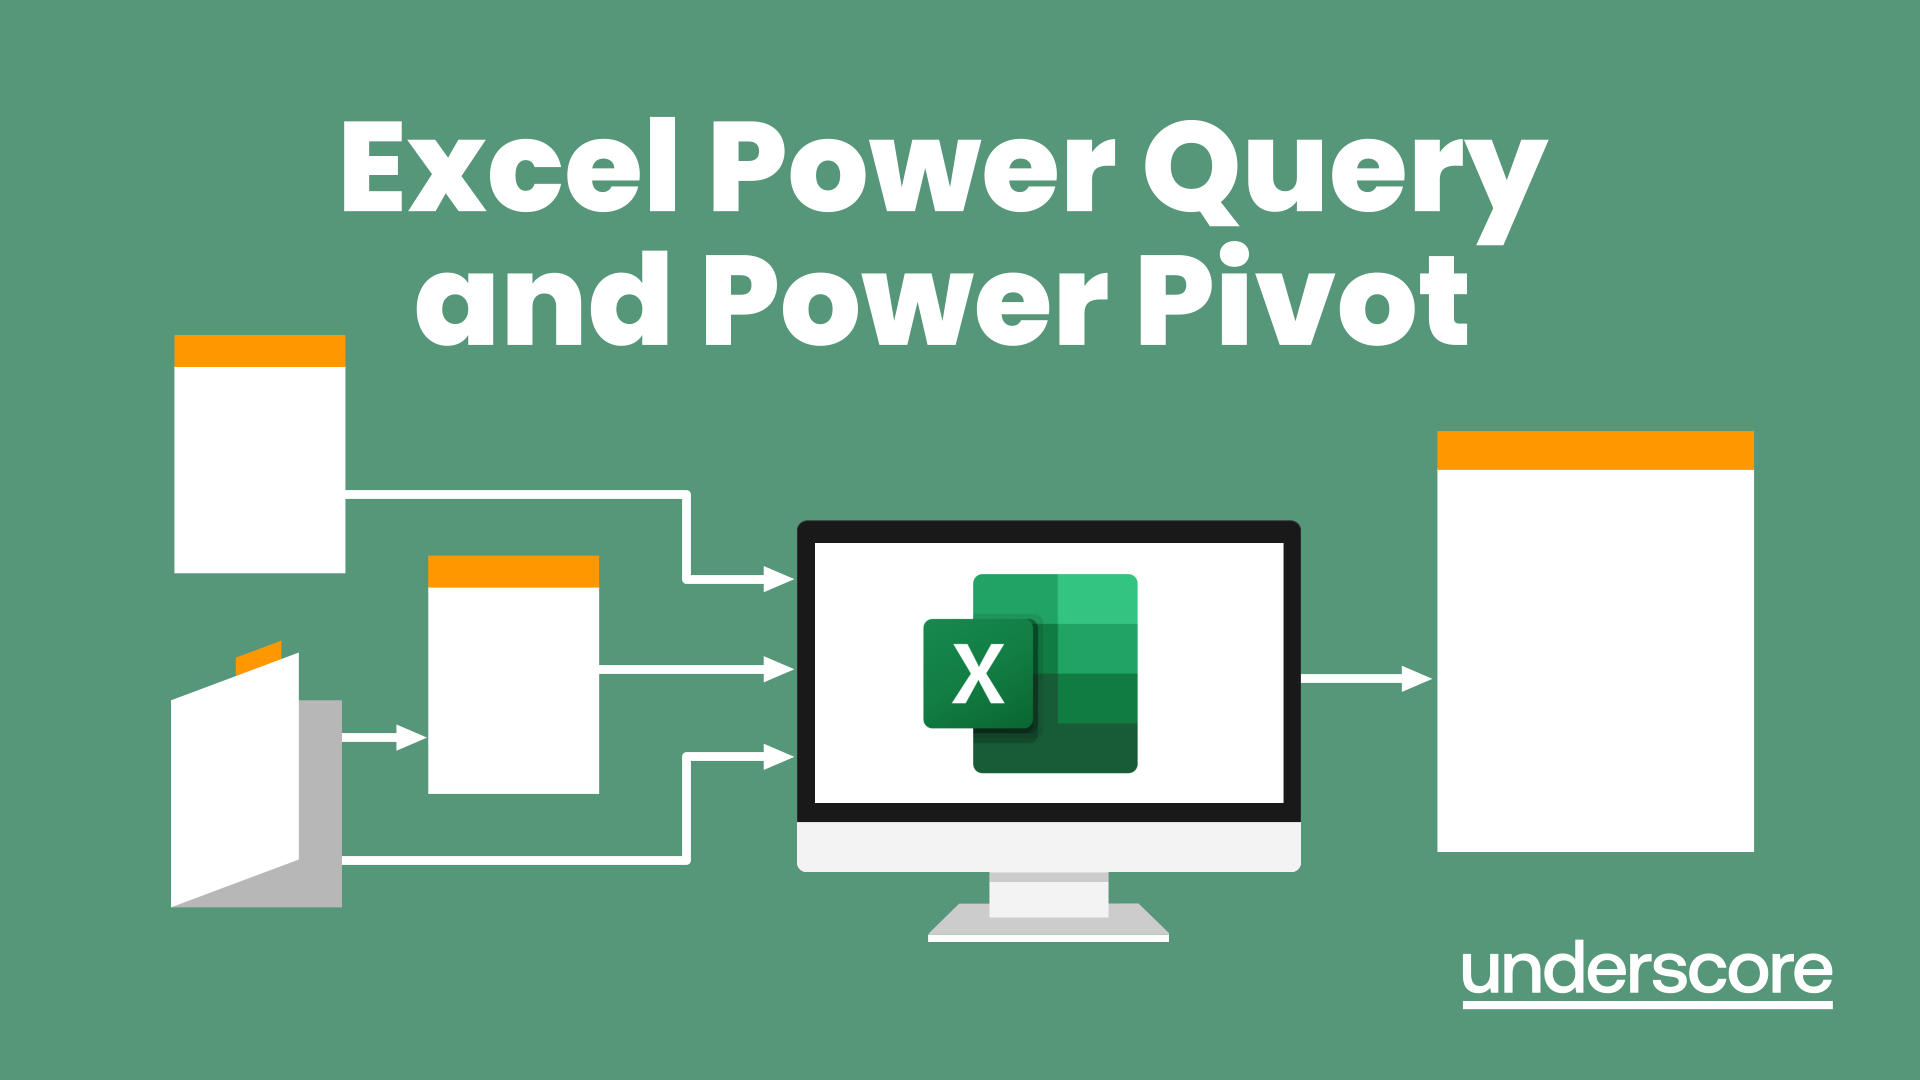
Excel Power Query and Power Pivot
By Underscore Group
Learn how to work with and connect multiple data sets to effectively analyse and report on data. -------------------------------------------------------------------------------- COURSE OVERVIEW Duration: 1 day (6.5 hours) Within Excel you have some powerful features to enable you to connect and analyse multiple data sources. Power Query enables you to import and manipulate your data, Power Pivot enables you to connect multiple data sources and create pivot tables and pivot charts from them. This course is an introduction to Power Query and Power Pivot in Excel to get you started on creating a powerful reporting capability. Knowledge of working with Excel workbooks and relational databases would be an advantage. OBJECTIVES By the end of the course you will be able to: * Import data from multiple data sources * Edit and transform data before importing * Add extra columns of data * Append data * Merge data from other tables * Create data models * Build data relationships * Build Pivot Tables * Build Pivot Charts * Use Slicers and Timeline Filters CONTENT IMPORTING DATA * Data sources * Importing data TRANSFORMING DATA * Editing your data * Setting data types * Removing columns/rows * Choosing columns to keep * Setting header rows * Splitting columns APPENDING QUERIES * Appending data from other tables ADDING TEXT * Columns from example * Custom columns * Conditional columns MERGE QUERIES * Setting up and using merge queries * Merging in columns of data CREATING A DATA MODEL * The data model * Multiple data tables * Connecting tables * Building relationships * Relationship types * Building visuals from multiple tables ANALYSING INFORMATION USING PIVOT TABLES * Creating and modifying a Pivot Table * Recalculating the Pivot Table * Filtering the Pivot Table * Searching the Pivot Table * Drilling down to underlying data * Customising field names * Changing field formatting PIVOT CHARTS, SLICES AND TIMELINES * Creating Pivot Charts * Adding and using Slicers
PL-200T00 Microsoft Power Platform Functional Consultant
By Nexus Human
Duration 5 Days 30 CPD hours This course is intended for A Microsoft Power Platform Functional Consultant is responsible for creating and configuring apps, automations, and solutions. They act as the liaison between users and the implementation team. The functional consultant promotes utilization of solutions within an organization. The functional consultant may perform discovery, engage subject matter experts and stakeholders, capture requirements, and map requirements to features. They implement components of a solution including application enhancements, custom user experiences, system integrations, data conversions, custom process automation, and simple visualizations. This course will teach you to use Microsoft Power Platform solutions to simplify, automate, and empower business processes for organizations in the role of a Functional Consultant. A Microsoft Power Platform Functional Consultant is responsible for creating and configuring apps, automations, and solutions. They act as the liaison between users and the implementation team. The functional consultant promotes utilization of solutions within an organization. The functional consultant may perform discovery, engage subject matter experts and stakeholders, capture requirements, and map requirements to features. They implement components of a solution including application enhancements, custom user experiences, system integrations, data conversions, custom process automation, and simple visualizations. This course may contain a 1-day Applied Workshop. This workshop will allow you to practice your Functional Consultant skills by creating an end-to-end solution to solve a problem for a fictitious company. The solution will include a Microsoft Dataverse database, Power Apps canvas app, and Power Automate flows. Prerequisites * Experience as an IT professional or student * Working knowledge of Microsoft Power Platform and its key components * Knowledge of Microsoft Dataverse (or general data modeling) and security concepts 1 - DESCRIBE THE BUSINESS VALUE OF THE MICROSOFT POWER PLATFORM * Explore Microsoft Power Platform * Describe the business value of the Power Platform * Explore connectors and Microsoft Dataverse * Describe how Power Platform works with Microsoft 365 apps and services * Explore how Power Platform works with Microsoft Teams * Describe how Power Platform works with Microsoft Dynamics 365 apps * Describe how Power Platform solutions consume Microsoft Azure services * Explore how Microsoft Power Platform apps work together * Use Artificial Intelligence to increase productivity 2 - CORE COMPONENTS OF POWER PAGES * Get started with Power Pages * Core tools and components of Power Pages * Overview of Power Pages security * Overview of Power Pages extensibility 3 - EXPLORE POWER PAGES TEMPLATES * Site design templates * Scenario-based templates * Dynamics 365 Power Pages site templates 4 - EXPLORE POWER PAGES DESIGN STUDIO * Work with pages * Page components * Site styling and templates 5 - EXPLORE POWER PAGES DESIGN STUDIO DATA AND SECURITY FEATURES * Data workspace in Power Pages design studio * Power Pages security features 6 - INTRODUCTION TO POWER PAGES ADMINISTRATION * Power Pages administrative tools * Set up workspace in Power Pages design studio 7 - GET STARTED BUILDING WITH POWER BI * Use Power BI * Building blocks of Power BI * Tour and use the Power BI service 8 - GET DATA WITH POWER BI DESKTOP * Overview of Power BI Desktop * Explore Power BI Desktop * Connect to data sources * Get data from Excel * Transform data to include in a report * Combine data from multiple sources * Clean data to include in a report 9 - MODEL DATA IN POWER BI * How to manage your data relationships * Create calculated columns * Optimize data models * Create measures * Create calculated tables * Explore time-based data 10 - USE VISUALS IN POWER BI * Create and customize simple visualizations * Create slicers * Map visualizations * Matrices and tables * Create scatter, waterfall, and funnel charts * Modify colors in charts and visuals * Page layout and formatting 11 - EXPLORE DATA IN POWER BI * Quick insights in Power BI * Create and configure a dashboard * Ask questions of your data with natural language * Create custom Q&A suggestions * Share dashboards with your organization * Display visuals and tiles in full screen * Edit tile details and add widgets * Get more space on your dashboard 12 - PUBLISH AND SHARE IN POWER BI * Publish Power BI Desktop reports * Print and export dashboards and reports * Introducing Power BI Mobile * Create workspaces in Power BI * Build apps * Use apps * Integrate OneDrive for Business with Power BI * Publish to web 13 - CREATE AND MANAGE WORKSPACES IN POWER BI * Distribute a report or dashboard * Monitor usage and performance * Recommend a development life cycle strategy * Troubleshoot data by viewing its lineage * Configure data protection 14 - MANAGE SEMANTIC MODELS IN POWER BI * Use a Power BI gateway to connect to on-premises data sources * Configure a semantic model scheduled refresh * Configure incremental refresh settings * Manage and promote semantic models * Troubleshoot service connectivity * Boost performance with query caching (Premium) 15 - CREATE DASHBOARDS IN POWER BI * Configure data alerts * Explore data by asking questions * Review Quick insights * Add a dashboard theme * Pin a live report page to a dashboard * Configure a real-time dashboard * Set mobile view 16 - IMPLEMENT ROW-LEVEL SECURITY * Configure row-level security with the static method * Configure row-level security with the dynamic method 17 - CREATE TABLES IN DATAVERSE * Table characteristics * Table relationships * Dataverse logic and security * Dataverse auditing * Dual-write vs. virtual tables 18 - MANAGE TABLES IN DATAVERSE * Identify tables and table types in Dataverse * Create a custom table * Enable attachments within a table * Licensing requirements for each table type 19 - CREATE AND MANAGE COLUMNS WITHIN A TABLE IN DATAVERSE * Define columns in Microsoft Dataverse * Column types in Microsoft Dataverse * Add a column to a table * Create a primary name column * Restrictions that apply to columns in a table * Create an auto numbering column * Create an alternate key 20 - CREATE A RELATIONSHIP BETWEEN TABLES IN DATAVERSE * Relate one or more tables - Introduction * Relationship types that are available in Microsoft Dataverse * Create a one-to-many relationship between tables * Create a many-to-many relationship between tables * Edit or delete relationships 21 - WORKING WITH CHOICES IN DATAVERSE * Define choice column * Standard choices column 22 - GET STARTED WITH SECURITY ROLES IN DATAVERSE * Understand environment roles * Adding or disabling an environment user * Understand security concepts in Dataverse * Understand user security roles and security role defaults * Check the roles that a user belongs to * Configure Dataverse teams for security * Configure Dataverse group teams for security 23 - USE ADMINISTRATION OPTIONS FOR DATAVERSE * Use Microsoft Power Platform Admin Center portal * Tenant storage capacity * Advanced Customization options in Power Apps Portal * Enable and disable auditing 24 - MANAGE DYNAMICS 365 MODEL-DRIVEN APP SETTINGS AND SECURITY * Configure role-based security * Manage teams and business units * Explore settings and customizations 25 - INTRODUCTION TO MICROSOFT POWER PLATFORM SECURITY AND GOVERNANCE * Identify Microsoft Power Platform environments * Data Loss Prevention policies * Microsoft Power Platform Center of Excellence Starter Kit 26 - GET STARTED WITH MODEL-DRIVEN APPS IN POWER APPS * Introducing model-driven apps * Components of model-driven apps * Design model-driven apps * Incorporate business process flows 27 - CONFIGURE FORMS, CHARTS, AND DASHBOARDS IN MODEL-DRIVEN APPS * Forms overview * Form elements * Configure multiple forms * Use specialized form components * Configure views overview * Configure grids * Create and edit views * Configure charts overview * Dashboards overview * Use interactive streams and tiles 28 - GET STARTED WITH POWER APPS CANVAS APPS * Power Apps building blocks * Ways to build Power Apps * Power Apps related technologies * Additional Power Apps related technologies * Designing a Power Apps app 29 - CONNECT TO OTHER DATA IN A POWER APPS CANVAS APP * Overview of the different data sources * Work with action-based data sources * Power Automate is a companion to Power Apps 30 - HOW TO BUILD THE UI IN A CANVAS APP IN POWER APPS * Use themes to quickly change the appearance of your app * Branding a control * Icons * Images * Personalization * Using the tablet or phone form factors 31 - MANAGE APPS IN POWER APPS * Power Apps review 32 - BUILD YOUR FIRST APP WITH POWER APPS AND DATAVERSE FOR TEAMS * Create your first app with the hero template * Customize your app with Power Apps Studio * Publish your app * Install template apps 33 - ACCESS DATAVERSE IN POWER PAGES WEBSITES * Use lists to display multiple Dataverse records * Use forms to interact with Dataverse data 34 - AUTHENTICATION AND USER MANAGEMENT IN POWER PAGES * Power Pages authentication settings * User registration in Power Pages * Authentication management for Power Pages users * Power Pages authentication providers 35 - POWER PAGES MAINTENANCE AND TROUBLESHOOTING * Power Pages website maintenance * Power Pages website troubleshooting 36 - DEFINE AND CREATE BUSINESS RULES IN DATAVERSE * Define business rules - Introduction * Define the components of a business rule * Create a business rule 37 - GET STARTED WITH POWER AUTOMATE * Introducing Power Automate * Troubleshoot flows 38 - USE THE ADMIN CENTER TO MANAGE ENVIRONMENTS AND DATA POLICIES IN POWER AUTOMATE * Administer flows * Export and import flows * Learn how to distribute button flows 39 - USE DATAVERSE TRIGGERS AND ACTIONS IN POWER AUTOMATE * Dataverse triggers * Query data * Create, update, delete, and relate actions 40 - EXTEND DATAVERSE WITH POWER AUTOMATE * Set up a flow and configure its trigger * Email Dataverse record * Add to-do items * Test and run your flow 41 - INTRODUCTION TO EXPRESSIONS IN POWER AUTOMATE * Get started with expressions * Notes make things easier * Types of functions * Write complex expressions 42 - BUILD YOUR FIRST POWER AUTOMATE FOR DESKTOP FLOW * Set up the environment * Explore Power Automate for desktop * Create your first Power Automate for desktop flow * Record Power Automate for desktop actions * Edit and test recorded actions 43 - RUN A POWER AUTOMATE FOR DESKTOP FLOW IN UNATTENDED MODE * Set up an unattended desktop flow * Create a new cloud flow that calls an existing flow in unattended mode * Perform a test run * Best practices 44 - OPTIMIZE YOUR BUSINESS PROCESS WITH PROCESS ADVISOR * Get familiar with process advisor * Create your first recording * Edit recordings and group actions * Analyze recordings and interpret results * Automation recommendations 45 - GET STARTED WITH MICROSOFT COPILOT STUDIO BOTS * Get started working with environments * Create bots and work with the Microsoft Copilot Studio interface * Create topics * Test bots * Publish bots and analyze performance 46 - ENHANCE MICROSOFT COPILOT STUDIO BOTS * Use Power Automate to add actions * Transfer conversations to agents by using Omnichannel for Customer Service * Create topics for existing support content * Analyze bot performance 47 - MANAGE TOPICS IN MICROSOFT COPILOT STUDIO * Work with bot topics * Branch a topic * Create topics for existing support content * Work with system fallback topics * Manage topics 48 - MANAGE POWER VIRTUAL AGENTS * Environments in Microsoft Copilot Studio * Bot topics permissions * Bot entities and flow permissions * Monitor and diagnose * Administer and manage * Export and import bots * Authentication 49 - GET STARTED BUILDING WITH POWER BI * Use Power BI * Building blocks of Power BI * Tour and use the Power BI service 50 - GET DATA WITH POWER BI DESKTOP * Overview of Power BI Desktop * Explore Power BI Desktop * Connect to data sources * Get data from Excel * Transform data to include in a report * Combine data from multiple sources * Clean data to include in a report 51 - MODEL DATA IN POWER BI * How to manage your data relationships * Create calculated columns * Optimize data models * Create measures * Create calculated tables * Explore time-based data 52 - USE VISUALS IN POWER BI * Create and customize simple visualizations * Create slicers * Map visualizations * Matrices and tables * Create scatter, waterfall, and funnel charts * Modify colors in charts and visuals * Page layout and formatting 53 - EXPLORE DATA IN POWER BI * Quick insights in Power BI * Create and configure a dashboard * Ask questions of your data with natural language * Create custom Q&A suggestions * Share dashboards with your organization * Display visuals and tiles in full screen * Edit tile details and add widgets * Get more space on your dashboard 54 - PUBLISH AND SHARE IN POWER BI * Publish Power BI Desktop reports * Print and export dashboards and reports * Introducing Power BI Mobile * Create workspaces in Power BI * Build apps * Use apps * Integrate OneDrive for Business with Power BI * Publish to web 55 - MANAGE SOLUTIONS IN POWER APPS AND POWER AUTOMATE * Add and remove apps, flows, and entities in a solution * Edit a solution-aware app, flow, and table * Build and deploy a complex solution with flows, apps, and entities * Automate solution management 56 - LOAD/EXPORT DATA AND CREATE DATA VIEWS IN DATAVERSE * View data in a table * Create or edit views of data in a table * Load data into a table * Export data from a table * Add, update, or delete data in a table by using Excel * Import data using Power Query * Generate a new dataflow from an Excel Template * Dataflow and Azure integration 57 - GET STARTED WITH AI BUILDER * Choose an AI capability * Create your first model * Ways to use your models 58 - MANAGE MODELS IN AI BUILDER * Model lifecycle * Manage model versions * Share your models 59 - USE AI BUILDER IN POWER AUTOMATE * AI Builder in Power Automate saves time * Advanced usage of AI Builder in Power Automate 60 - FUNCTIONAL CONSULTANT SKILLS * Create entity relationship diagrams * Create and document mock-ups * Document functional requirements and artifacts * Complete fit-gap analysis * Discuss stakeholder management responsibilities * Understand industry accelerators * Define Application Lifecycle Management * Participate in testing * Evaluate options * Define connectors * Understand Power Apps component framework 61 - SOLUTION ARCHITECT SERIES: PLAN APPLICATION LIFECYCLE MANAGEMENT FOR POWER PLATFORM * Key considerations for ALM * Solutions * Configuration and reference data * Release process * ALM with Azure DevOps

Programming and Data Wrangling with VBA and Excel
By Nexus Human
Duration 3 Days 18 CPD hours This course is intended for This course is primarily designed for students who want to gain the skills necessary to use VBA to automate tasks in Excel such as collecting data from external sources, cleaning, and manipulating data. The target student may also want to learn how to create custom worksheet functions to streamline worksheet formulas and make complex worksheets easier to support, maintain, and understand. Overview In this course, you will develop and deploy VBA modules to solve business problems. You will: Identify general components of VBA and their appropriate use in solving business solutions. Record VBA macros to automate repetitive tasks. Use reference tools built into Excel to get help on VBA programming language and objects used in the Excel VBA environment. Write VBA code to create a custom worksheet function. Eliminate, avoid, or handle errors in VBA code, and optimize its performance. Control how and when macros run. Develop UserForm objects to create custom dialog boxes and windows. Use VBA to read and write data from local files and cloud services. Use VBA to clean and transform data. Run programs and commands outside of Excel and share VBA projects with other users VBA (Visual Basic for Applications) enables you to enhance and extend the capabilities of Microsoft© Excel© and other applications in the Microsoft© Office application suite. You can use VBA to perform tasks that would be difficult or impossible to do using only worksheet functions, and you can automate a wide range of tasks involving the collection, processing, analysis, and visualization of data. This course will give you a good foundation for understanding, creating, and using VBA in your own Excel workbooks, show you how to work with data across different applications, and how to package the macros and functions you create so you can back them up, move them to other computers, and share them with other users Prerequisites To ensure your success in this course, you should be an experienced Excel user who is comfortable creating and working with Excel workbooks, including tasks such as entering worksheet formulas, using absolute and relative addressing, formatting cells, and creating pivot tables and charts. This level of skill could be acquired by taking the Microsoft Excel for Office 365? (Desktop or Online) courses, Parts 1, 2, and 3 1 - USING VBA TO SOLVE BUSINESS PROBLEMS * Topic A: Use Macros to Automate Tasks in Excel * Topic B: Identify Components of Macro-Enabled Workbooks * Topic C: Configure the Excel VBA Environment 2 - AUTOMATING REPETITIVE TASKS * Topic A: Use the Macro Recorder to Create a VBA Macro * Topic B: Record a Macro with Relative Addressing * Topic C: Delete Macros and Modules * Topic D: Identify Strategies for Using the Macro Recorder 3 - GETTING HELP ON VBA * Topic A: Use VBA Help * Topic B: Use the Object Browser to Discover Objects You Can Use in VBA * Topic C: Use the Immediate Window to Explore Object Properties and Methods 4 - CREATING CUSTOM WORKSHEET FUNCTIONS * Topic A: Create a Custom Function * Topic B: Make Decisions in Code * Topic C: Work with Variables * Topic D: Perform Repetitive Tasks 5 - IMPROVING YOUR VBA CODE * Topic A: Debug VBA Errors * Topic B: Deal with Errors * Topic C: Improve Macro Performance 6 - CONTROLLING HOW AND WHEN MACROS RUN * Topic A: Prompt the User for Information * Topic B: Configure Macros to Run Automatically 7 - DEVELOPING CUSTOM FORMS * Topic A: Display a Custom Dialog Box * Topic B: Program Form Events 8 - USING VBA TO WORK WITH FILES * Topic A: Use VBA to Get File and Directory Structure * Topic B: Use VBA to Read Text Files * Topic C: Use VBA to Write Text Files 9 - USING VBA TO CLEAN AND TRANSFORM DATA * Topic A: Automate Power Query * Topic B: Transform Data Using VBA and Workbook Functions * Topic C: Use Regular Expressions * Topic D: Manage Errors in Data 10 - EXTENDING THE PROGRAMMING ENVIRONMENT BEYOND THE WORKBOOK * Topic A: Run Other Programs and Commands * Topic B: Share Your VBA Projects
Advanced Data Modelling and Shaping (MSIAD)
By Online Productivity Training
OVERVIEW Prerequisites—DIAD training or equivalent working experience This one-day course will cover using Power BI Desktop to import and shape data from a variety of sources. It will also walk through Power BI capabilities you can use to enhance the data model for your business users. The course covers key aspects of how to create a great data model to meet your business needs, various features in Power BI used to enhance data models so you can build great reports, and an introduction to DAX to create calculations. After completing this training, the attendees should be able to import data from a variety of data sources into Power BI, shape the data, create the data model, and write DAX functions to the Power BI model. COURSE BENEFITS: * Understand the Power BI Desktop data model, its components and most effective schemas * Describe concepts of calculated columns and measures * Create queries using M * Create calculations with DAX * Understand the use of functions * Create and optimize a data model * Understand the consequences of data model design decisions WHO IS THE COURSE FOR? * Power BI report developers who wish to improve the structure of their data models * Power BI report developers who wish to use advanced features like parameters and M coding in Power Query * Power BI practitioners who wish to optimise their models more effectively * Attendees wishing to prepare thoroughly for the DAX In A Day course COURSE OUTLINE Module 1 Getting And Shaping The Data * Understand what is meant by data model in the context of Power BI * Understand the consequences of data model design decisions * Understand consequences of Power BI’s data type handling * Understand data connection options Module 2 Basic Data Modelling * Understand basic data modelling * Understand basic data model types * Explore dimension tables and fact tables * Explore data connections Module 3 Getting Started With M (Power Query Language) * Get introduced to M * Understand key components and syntax Module 4 Understanding Logic Operators * Understand Transformations * Understand Join operation Module 5 Introduction To DAX * Get introduced to DAX and how can it be used * Understand working with parameters and DAX (lab combining the previous module) Module 6 Working With Functions - DAX CALCULATE And More * Understand working with functions * Understand the basics of the CALCULATE formula Module 7 Modelling With Power BI & DAX Best Practice * Gain familiarity with basic data modelling for business scenarios * Learn some best practices for working with Power BI
Dashboard In A Day (DIAD)
By Online Productivity Training
OVERVIEW DIAD is a one-day, hands-on workshop for business analysts, covering the breadth of Power BI capabilities. The course focuses on five practical Labs and at the end of the day, attendees will better understand how to: * Connect and transform data from a variety of data sources. * Define business rules and KPIs. * Explore data with powerful interactive visuals. * Build stunning reports. * Share their dashboards with their team business partners and publish them to the web. The course content is managed by the Power BI engineering team at Microsoft. There is no exam associated with the course. COURSE BENEFITS: * Learn how to clean, transform, and load data from various sources * Create and manage a data model in Power BI consisting of multiple tables connected with relationships * Build Measures and other calculations in the DAX language to plot in reports * Manage and share report assets to the Power BI Service WHO IS THE COURSE FOR? * Data Analysts and Management Consultants with little or no experience of Power BI who wish to upgrade their knowledge to include Business Intelligence * Analysts looking for a quick introduction to Power BI who don’t have the time for the full three day PL-300 course * Marketers in data-intensive organisations who need new tools to build visually appealing, dynamic charts for their stakeholders to use LAB OUTLINE Lab 1 Accessing & Preparing The Data * Load data from Excel and CSV sources * Manipulate the data to prepare it for reporting * Prepare tables in Power Query and load them into the data model Lab 2 Data Modelling And Exploration * Create a range of different charts * Highlight and cross-filter * Create new groups and hierarchies * Add new measures to the model Lab 3 Data Visualization * Add conditional formatting to a report * Add logos to a filter * Import a custom visual * Apply a custom theme * Add bookmarks to the report to tell a story Lab 4 Publishing A Report And Creating A Dashboard * Create a Workspace in the Power BI Service * Publish a report to the Service * Create a Dashboard and pin visuals to it * Generate and view insights Lab 5 Collaboration * Share a Dashboard * Access a Dashboard on a Mobile Device

PL-100T00 Microsoft Power Platform App Maker
By Nexus Human
Duration 4 Days 24 CPD hours This course is intended for The App Maker builds solutions to simplify, automate, and transform tasks and processes for themselves and their team where they have deep expertise in the solution business domain. They have basic data modeling, user experience design, requirements analysis, and process analysis skills. The App Maker creates and enforces business processes, structures digital collection of information, improves efficiency of repeatable tasks, and automates business processes. The App Maker uses the Maker tools of Power Platform to solve business problems. They may use advanced features of Microsoft apps and third-party productivity tools. The App Maker is aware of the capabilities and limitations of available tools and understands how to apply them. The App Maker is self-directed, and solution focused. They may not have formal IT training but are comfortable using technology to solve business problems with a personal growth mindset. They understand the operational need and have a vision of the desired outcome. They approach problems with phased and iterative strategies. This course will teach you how to build apps with low-code techniques to simplify, automate, and transform business tasks and processes using Microsoft Power Platform. This course contains a 1-day Applied Workshop. This workshop will allow you to practice your App Maker skills by creating an end-to-end solution to solve a problem for a fictitious company. The solution will include a Microsoft Dataverse database, Power Apps canvas app, and Power Automate flows. 1 - GET STARTED WITH MICROSOFT POWER PLATFORM FOR APP MAKERS * Identify components * Create apps * Get started with Microsoft Dataverse * Work with Copilot in Microsoft Power Platform 2 - CREATE TABLES IN DATAVERSE * Table characteristics * Table relationships * Dataverse logic and security * Dataverse auditing * Dual-write vs. virtual tables 3 - CREATE AND MANAGE COLUMNS WITHIN A TABLE IN DATAVERSE * Define columns in Microsoft Dataverse * Column types in Microsoft Dataverse * Add a column to a table * Primary name column * Restrictions that apply to columns in a table * Create an auto numbering column * Create an alternate key 4 - LOAD/EXPORT DATA AND CREATE DATA VIEWS IN DATAVERSE * View data in a table * Create or edit views of data in a table * Dataverse data import options * Load data into a table * Dataverse data export options * Export * Add, update, or delete data in a table by using Excel * Import data using Power Query 5 - EXPORT DATA FROM DATAVERSE AND USE MICROSOFT EXCEL TO EDIT RECORDS * Export data to Excel * Edit and update data in Excel 6 - GET STARTED WITH MICROSOFT DATAVERSE FOR TEAMS * Dataverse for Teams vs Dataverse * Provision your first Dataverse environment * Create your first table to store data 7 - BUILD YOUR FIRST APP WITH POWER APPS AND DATAVERSE FOR TEAMS * Create your first app with the hero template * Customize your app with Power Apps Studio * Publish your app * Install template apps 8 - BUILD YOUR FIRST WORKFLOW WITH POWER AUTOMATE AND DATAVERSE FOR TEAMS * Types of workflows that Power Automate can build in Dataverse * Schedule a flow 9 - CREATE REPORTS WITH POWER BI AND DATAVERSE FOR TEAMS * Connect to and transform Dataverse for Teams data from Power BI * Create a Power BI report * Publish the report * Share the data 10 - GET STARTED BUILDING WITH POWER BI * Use Power BI * Building blocks of Power BI * Tour and use the Power BI service 11 - EXPLORE WHAT POWER BI CAN DO FOR YOU * What can I do with the Power BI service as a consumer? * View content in the Power BI service * Collaborate and share in Power BI * Find and view dashboards and reports 12 - CREATE AND MANAGE WORKSPACES IN POWER BI * Distribute a report or dashboard * Monitor usage and performance * Recommend a development life cycle strategy * Troubleshoot data by viewing its lineage * Configure data protection 13 - MANAGE SEMANTIC MODELS IN POWER BI * Use a Power BI gateway to connect to on-premises data sources * Configure a semantic model scheduled refresh * Configure incremental refresh settings * Manage and promote semantic models * Troubleshoot service connectivity * Boost performance with query caching (Premium) 14 - CREATE DASHBOARDS IN POWER BI * Configure data alerts * Explore data by asking questions * Review Quick insights * Add a dashboard theme * Pin a live report page to a dashboard * Configure a real-time dashboard * Set mobile view 15 - IMPLEMENT ROW-LEVEL SECURITY * Configure row-level security with the static method * Configure row-level security with the dynamic method 16 - CREATE DASHBOARDS IN POWER BI * Configure data alerts * Explore data by asking questions * Review Quick insights * Add a dashboard theme * Pin a live report page to a dashboard * Configure a real-time dashboard * Set mobile view 17 - SECURE, PUBLISH, AND SHARE DATA IN POWER BI * Share and use reports in Power BI * Row-level security * Publish a report to a Power BI workspace * Share reports and user experience * Protect data in Power BI * Data refresh and alerts 18 - EMBED POWER BI CONTENT * Embed Power BI reports * Embed other Power BI content types * Optimize the embedding experience 19 - HOW TO BUILD YOUR FIRST MODEL-DRIVEN APP WITH DATAVERSE * Model-driven apps, powered by Microsoft Dataverse * Explore sample apps 20 - GET STARTED WITH MODEL-DRIVEN APPS IN POWER APPS * Introducing model-driven apps * Components of model-driven apps * Design model-driven apps * Incorporate business process flows 21 - CONFIGURE FORMS, CHARTS, AND DASHBOARDS IN MODEL-DRIVEN APPS * Forms overview * Form elements * Configure multiple forms * Use specialized form components * Configure views overview * Configure grids * Create and edit views * Configure charts overview * Dashboards overview * Use interactive streams and tiles 22 - MANAGE DYNAMICS 365 MODEL-DRIVEN APP SETTINGS AND SECURITY * Configure role-based security * Manage teams and business units * Explore settings and customizations 23 - USE SPECIALIZED COMPONENTS IN A MODEL-DRIVEN FORM * Create business process flows * Embed a canvas app in a model-driven form * Add a timeline in a model-driven form * Create a report in a model-driven form 24 - GET STARTED WITH POWER APPS CANVAS APPS * Start Power Apps * Power Apps data sources * Use Power Apps with Power Automate and Power BI * Designing a Power Apps app 25 - CUSTOMIZE A CANVAS APP IN POWER APPS * Improve your app by making basic customizations * Explore controls and screens in canvas apps 26 - HOW TO BUILD THE USER INTERFACE IN A CANVAS APP IN POWER APPS * Use themes to quickly change the appearance of your app * Brand a control * Icons * Images * Personalization * Build for phones or tablets 27 - NAVIGATION IN A CANVAS APP IN POWER APPS * Understanding navigation * The Navigate and Back functions * More ways to use the Navigate function 28 - MANAGE APPS IN POWER APPS * Power Apps review 29 - BUILD A MOBILE-OPTIMIZED APP FROM POWER APPS * Learn about mobile-optimized apps * Identify components to make a canvas app mobile-optimized * Create a mobile-optimized app that uses responsive designs * Identify performance considerations for a mobile-optimized canvas app 30 - USE AND UNDERSTAND CONTROLS IN A CANVAS APP IN POWER APPS * Core properties of controls * Entering and displaying data with text controls * Additional controls for enhancing your app's usability * Media * Modern controls * Work with component libraries 31 - CREATE FORMULAS TO CHANGE PROPERTIES IN A POWER APPS CANVAS APP * Formulas overview * Use a formula to modify the format of controls * Use formulas to perform calculations * Use a control to modify the property of other controls * Conditional formatting * Functions for validating data 32 - USE IMPERATIVE DEVELOPMENT TECHNIQUES FOR CANVAS APPS IN POWER APPS * Imperative versus declarative development * The three types of variables in Power Apps * Global variables * Contextual variables * Collections * Additional variable concepts 33 - MANAGE APPS IN POWER APPS * Power Apps review 34 - CREATE FORMULAS TO CHANGE PROPERTIES IN A POWER APPS CANVAS APP * Formulas overview * Use a formula to modify the format of controls * Use formulas to perform calculations * Use a control to modify the property of other controls * Conditional formatting * Functions for validating data 35 - CREATE FORMULAS TO CHANGE BEHAVIORS IN A POWER APPS CANVAS APP * Formulas and functionality * Understanding true and false * Understanding control behaviors and actions * Performing multiple actions in a formula * Control the display mode through a formula * Use controls and functions to create a dynamic formula 36 - AUTHOR A BASIC FORMULA THAT USES TABLES AND RECORDS IN A POWER APPS CANVAS APP * Records and tables * Using the Table function * Store a table * Filter your table * Use the lookup function to return a record * Additional table functions 37 - BUILD A CANVAS APP FOR A REAL ESTATE SOLUTION WITH COPILOT IN POWER APPS 38 - GET STARTED WITH POWER AUTOMATE * Introducing Power Automate * Create your first flow * Troubleshoot flows 39 - BUILD APPROVAL FLOWS WITH POWER AUTOMATE * Provide solutions to real-world scenarios. 40 - BUILD FLOWS TO MANAGE USER INFORMATION 41 - POWER AUTOMATE'S DEEP INTEGRATION ACROSS MULTIPLE DATA SOURCES 42 - USE THE ADMIN CENTER TO MANAGE ENVIRONMENTS AND DATA POLICIES IN POWER AUTOMATE * Administer flows * Export and import flows * Learn how to distribute button flows 43 - USE AI BUILDER IN POWER AUTOMATE * AI Builder in Power Automate saves time * Advanced usage of AI Builder in Power Automate 44 - OPTIMIZE YOUR BUSINESS PROCESS WITH PROCESS ADVISOR * Get familiar with process advisor * Create your first recording * Edit recordings and group actions * Analyze recordings and interpret results * Automation recommendations 45 - OPTIMIZE YOUR BUSINESS PROCESS WITH PROCESS ADVISOR * Get familiar with process advisor * Create your first recording * Edit recordings and group actions * Analyze recordings and interpret results * Automation recommendations 46 - BUILD FLOWS FOR A REAL ESTATE SOLUTION USING COPILOT IN POWER AUTOMATE * When to use Copilot in Power Automate 47 - USE DATAVERSE TRIGGERS AND ACTIONS IN POWER AUTOMATE * Dataverse triggers * Query data * Create, update, delete, and relate actions 48 - CREATE TABLES IN DATAVERSE * Table characteristics * Table relationships * Dataverse logic and security * Dataverse auditing * Dual-write vs. virtual tables 49 - CREATE AND MANAGE COLUMNS WITHIN A TABLE IN DATAVERSE * Define columns in Microsoft Dataverse * Column types in Microsoft Dataverse * Add a column to a table * Primary name column * Restrictions that apply to columns in a table * Create an auto numbering column * Create an alternate key 50 - GET STARTED WITH POWER APPS CANVAS APPS * Start Power Apps * Power Apps data sources * Use Power Apps with Power Automate and Power BI * Designing a Power Apps app 51 - HOW TO BUILD THE USER INTERFACE IN A CANVAS APP IN POWER APPS * Use themes to quickly change the appearance of your app * Brand a control * Icons * Images * Personalization * Build for phones or tablets 52 - GET STARTED WITH POWER AUTOMATE * Introducing Power Automate * Create your first flow * Troubleshoot flows 53 - CHALLENGE PROJECT - BUILD A BOOKING REQUESTS APP WITH POWER APPS AND POWER AUTOMATE * Prepare
Power BI - introduction (2 day) (In-House)
By The In House Training Company
There is a lot to learn in Power BI, this course takes a comprehensive look at the fundamentals of analysing data and includes a balanced look at the four main components that make up Power BI Desktop: Report view, Data view, Model view, and the Power Query Editor. It also demonstrates how to utilise the online Power BI service. It looks at authoring tools that enable you to connect to and transform data from a variety of sources, allowing you to produce detailed reports through a range of visualisations, in an interactive and dynamic way. It also includes a detailed look at formulas by writing both M functions in Power Query, and DAX functions in Desktop view. This knowledge will allow you to take your reports to the next level. The aim of this course is to provide a complete introduction to understanding the Power BI analysis process, by working hands-on with examples that will equip you with the necessary skills to start applying your learning straight away. 1 GETTING STARTED * The Power BI ecosystem * Opening Power BI Desktop * Power BI's four views * Introduction to Dashboards 2 IMPORTING FILES * Importing data sources * Importing an Excel file * Importing a CSV file * Importing a database * Connect to an SQL Server Database * Import vs. Direct Query * Importing from the web * Importing a folder of files * Managing file connections 3 SHAPE DATA IN THE QUERY EDITOR * The process of shaping data * Managing data types * Keeping and removing rows * Add a custom column * Appending tables together * Hiding queries in reports * Fixing error issues * Basic maths operations 4 THE DATA MODEL * Table relationships * Relationship properties 5 MERGE QUERIES * Table join kinds * Merging tables 6 INSERTING DASHBOARD VISUALS * Things to keep in mind * Inserting maps * Formatting Maps * Inserting charts * Formatting Charts * Inserting a tree map * Inserting a table, matrix, and card * Controlling number formats * About report themes * Highlighting key points * Filter reports with slicers * Sync slicers across dashboards * Custom web visuals 7 PUBLISH AND SHARE REPORTS * Publishing to Power BI service * Editing online reports * Pinning visuals to a dashboard * What is Q&A? * Sharing dashboards * Exporting reports to PowerPoint * Exporting reports as PDF files 8 THE POWER QUERY EDITOR * Fill data up and down * Split column by delimiter * Add a conditional column * More custom columns * Merging columns 9 THE M FUNCTIONS * Inserting text functions * Insert an IF function * Create a query group 10 PIVOTING TABLES * Pivot a table * Pivot and append tables * Pivot but don't aggregate * Unpivot tables * Append mismatched headers 11 DATA MODELLING EXPANDED * Understanding relationships * Mark a date table 12 DAX NEW COLUMNS * New columns and measures * New column calculations * Insert a SWITCH function 13 INTRODUCTION TO DAX MEASURES * Common measure functions * Insert a SUM function * Insert a COUNTROWS function * Insert a DISTINCTCOUNT function * Insert a DIVIDE function * DAX rules 14 THE CALCULATE MEASURE * The syntax of CALCULATE * Insert a CALCULATE function * Control field summarisation * Things of note 15 THE SUMX MEASURE * X iterator functions * Anatomy of SUMX * Insert a SUMX function * When to use X functions 16 TIME INTELLIGENCE MEASURES * Importance of a calendar table * Insert a TOTALYTD function * Change financial year end date * Comparing historical data * Insert a DATEADD function 17 HIERARCHIES AND GROUPS * Mine data using hierarchies * Compare data in groups

Power BI - introduction to intermediate (2 days) (In-House)
By The In House Training Company
This course starts with the basics then moves seamlessly to an intermediate level. It includes a comprehensive yet balanced look at the four main components that make up Power BI Desktop: Report view, Data view, Model view, and the Power Query Editor. It also demonstrates how to use the online Power BI service. It looks at authoring tools that enables you to connect to and transform data from a variety of sources, allowing you to produce dynamic reports using a library of visualisations. Once you have those reports, the course looks at the seamless process of sharing those with your colleagues by publishing to the online Power BI service. The aim of this course is to provide a strong understanding of the Power BI analysis process, by working with real-world examples that will equip you with the necessary skills to start applying your knowledge straight away. 1 GETTING STARTED * The Power BI process * Launching Power BI Desktop * The four views of Power BI * Dashboard visuals 2 CONNECTING TO FILES * Connect to data sources * Connect to an Excel file * Connect to a CSV file * Connect to a database * Import vs. DirectQuery * Connect to a web source * Create a data table 3 TRANSFORMING DATA * The process of cleaning data * Column data types * Remove rows with filters * Add a custom column * Append data to a table * Fix error issues * Basic maths operations 4 BUILD A DATA MODEL * Table relationships * Manage table relationships 5 MERGE QUERIES * Table join kinds * Merging tables 6 CREATE REPORT VISUALISATIONS * Creating map visuals * Formatting maps * Creating chart visuals * Formatting chart * Tables, matrixes, and cards * Control formatting with themes * Filter reports with slicers * Reports for mobile devices * Custom online visuals * Export report data to Excel 7 THE POWER QUERY EDITOR * Fill data up and down * Split columns by delimiter * Add conditional columns * Merging columns 8 THE M FORMULA * Creating M functions * Create an IF function * Create a query group 9 PIVOT AND UNPIVOT TABLES * Pivot tables in the query editor * Pivot and append tables * Pivot but don't summarise * Unpivot tables * Append mismatched headers 10 DATA MODELLING REVISITED * Data model relationships * Mark a calendar as a date table 11 INTRODUCTION TO CALCULATED COLUMNS * New columns vs. measures * Creating a new column calculation * The SWITCH function 12 INTRODUCTION TO DAX MEASURES * Common measure categories * The SUM measure * Adding measures to visuals * COUNTROWS and DISINCTCOUNT functions * DAX rules 13 THE CALCULATE MEASURE * The syntax of CALCULATE * Things of note about CALCULATE 14 THE SUMX MEASURE * The SUMX measure * X iterator functions * Anatomy of SUMX 15 INTRODUCTION TO TIME INTELLIGENCE * Importance of a calendar table * A special lookup table * The TOTALYTD measure * Change year end in TOTALYTD 16 HIERARCHY, GROUPS AND FORMATTING * Create a hierarchy to drill data * Compare data in groups * Add conditional formatting 17 SHARE REPORTS ON THE WEB * Publish to the BI online service * Get quick insights * Upload reports from BI service * Exporting report data * What is Q&A? * Sharing your reports 18 APPLY YOUR LEARNING * Post training recap lesson