196 Courses delivered On Demand
Get a 10% discount on your first order when you use this promo code at checkout: MAY24BAN3X

A Beginners Guide to Visualisation
By Course Cloud
COURSE OVERVIEW Discover how self-awareness and mental imagery can forge a path to better outcomes by taking A Beginners Guide to Visualisation. As human beings, our frailties and lack of conviction can often prevent us from reaching goals and objectives. With the help of this introductory training, you will be able to literally imagine your future and work towards attaining it with new levels of vigour and purpose. This Visualisation course focuses on the most effective ways to use the power of the mind to provide the impetus for actions and success. From the basic concepts of visualisation and its uses, you will be given a demonstration of how it has been used in the past and why it is still a valuable process that experts use time and time again. Taking you on a complete learning curve, even if you have had no previous experience, you will soon be capable of building pictures in your head that you will be able to make come true in the physical world. This best selling A Beginners Guide to Visualisation has been developed by industry professionals and has already been completed by hundreds of satisfied students. This in-depth A Beginners Guide to Visualisation is suitable for anyone who wants to build their professional skill set and improve their expert knowledge. The A Beginners Guide to Visualisation is CPD-accredited, so you can be confident you're completing a quality training course will boost your CV and enhance your career potential. The A Beginners Guide to Visualisation is made up of several information-packed modules which break down each topic into bite-sized chunks to ensure you understand and retain everything you learn. After successfully completing the A Beginners Guide to Visualisation, you will be awarded a certificate of completion as proof of your new skills. If you are looking to pursue a new career and want to build your professional skills to excel in your chosen field, the certificate of completion from the A Beginners Guide to Visualisation will help you stand out from the crowd. You can also validate your certification on our website. We know that you are busy and that time is precious, so we have designed the A Beginners Guide to Visualisation to be completed at your own pace, whether that's part-time or full-time. Get full course access upon registration and access the course materials from anywhere in the world, at any time, from any internet-enabled device. Our experienced tutors are here to support you through the entire learning process and answer any queries you may have via email.

Professional Arduino Data Visualisation using Python
By Lead Academy
PROFESSIONAL ARDUINO DATA VISUALISATION USING PYTHON COURSE OVERVIEW Are you looking to begin your Arduino data visualisation career or want to develop more advanced skills in Arduino data visualisation? Then this professional Arduino data visualisation using Python course will set you up with a solid foundation to become a confident Python progammer or electronic and electrical engineer and help you to develop your expertise in Arduino data visualisation. This professional Arduino data visualisation using Python course is accredited by the CPD UK & IPHM. CPD is globally recognised by employers, professional organisations and academic intuitions, thus a certificate from CPD Certification Service creates value towards your professional goal and achievement. CPD certified certificates are accepted by thousands of professional bodies and government regulators here in the UK and around the world. Whether you are self-taught and you want to fill in the gaps for better efficiency and productivity, this professional Arduino data visualisation using Python course will set you up with a solid foundation to become a confident Python progammer or electronic and electrical engineer and develop more advanced skills. Gain the essential skills and knowledge you need to propel your career forward as a Python progammer or electronic and electrical engineer. The professional Arduino data visualisation using Python course will set you up with the appropriate skills and experience needed for the job and is ideal for both beginners and those currently working as a Python progammer or electronic and electrical engineer. This comprehensive professional Arduino data visualisation using Python course is the perfect way to kickstart your career in the field of Arduino data visualisation. This professional Arduino data visualisation using Python course will give you a competitive advantage in your career, making you stand out from all other applicants and employees. If you're interested in working as a Python progammer or electronic and electrical engineer or want to learn more skills on Arduino data visualisation but unsure of where to start, then this professional Arduino data visualisation using Python course will set you up with a solid foundation to become a confident Python progammer or electronic and electrical engineer and develop more advanced skills. As one of the leading course providers and most renowned e-learning specialists online, we're dedicated to giving you the best educational experience possible. This professional Arduino data visualisation using Python course is crafted by industry experts, to enable you to learn quickly and efficiently, and at your own pace and convenience. WHO SHOULD TAKE THIS COURSE? This comprehensive professional Arduino data visualisation using Python course is suitable for anyone looking to improve their job prospects or aspiring to accelerate their career in this sector and want to gain in-depth knowledge of Arduino data visualisation. ENTRY REQUIREMENTS * There are no academic entry requirements for this professional Arduino data visualisation using Python course, and it is open to students of all academic backgrounds. * As long as you are aged seventeen or over and have a basic grasp of English, numeracy and ICT, you will be eligible to enrol. CAREER PATH This professional Arduino data visualisation using Python course opens a brand new door for you to enter the relevant job market and also provides you with the chance to accumulate in-depth knowledge at the side of needed skills to become flourishing in no time. You will also be able to add your new skills to your CV, enhance your career and become more competitive in your chosen industry. COURSE CURRICULUM Introduction Introduction Who We Are Hardware and Software Requirements Download and Install Software Section Download and Install Arduino Pro IDE Download and Install Python Editor Download and Install Required Libraries Python Coding to Control Arduino Pins Python Coding to Control Pin Via Serial Arduino Coding to Control Pin Via Serial Running Python Script to Control the Pin Python Coding to Control Arduino Pins Python GUI with Button to Control Arduino Pins Arduino Real-Time Plotting with Python Arduino Real-Time Plotting with Python Arduino Input/Output Control Via Python Blink Simple Led Example with Python Reading Digital Input and Sending Digital Output with Python Extra Installing Python and PIP RECOGNISED ACCREDITATION CPD CERTIFICATION SERVICE This course is accredited by continuing professional development (CPD). CPD UK is globally recognised by employers, professional organisations, and academic institutions, thus a certificate from CPD Certification Service creates value towards your professional goal and achievement. CPD certificates are accepted by thousands of professional bodies and government regulators here in the UK and around the world. Many organisations look for employees with CPD requirements, which means, that by doing this course, you would be a potential candidate in your respective field. CERTIFICATE OF ACHIEVEMENT CERTIFICATE OF ACHIEVEMENT FROM LEAD ACADEMY After successfully passing the MCQ exam you will be eligible to order your certificate of achievement as proof of your new skill. The certificate of achievement is an official credential that confirms that you successfully finished a course with Lead Academy. Certificate can be obtained in PDF version at a cost of £12, and there is an additional fee to obtain a printed copy certificate which is £35. FAQS IS CPD A RECOGNISED QUALIFICATION IN THE UK? CPD is globally recognised by employers, professional organisations and academic intuitions, thus a certificate from CPD Certification Service creates value towards your professional goal and achievement. CPD-certified certificates are accepted by thousands of professional bodies and government regulators here in the UK and around the world. ARE QLS COURSES RECOGNISED? Although QLS courses are not subject to Ofqual regulation, they must adhere to an extremely high level that is set and regulated independently across the globe. A course that has been approved by the Quality Licence Scheme simply indicates that it has been examined and evaluated in terms of quality and fulfils the predetermined quality standards. WHEN WILL I RECEIVE MY CERTIFICATE? For CPD accredited PDF certificate it will take 24 hours, however for the hardcopy CPD certificate takes 5-7 business days and for the Quality License Scheme certificate it will take 7-9 business days. CAN I PAY BY INVOICE? Yes, you can pay via Invoice or Purchase Order, please contact us at info@lead-academy.org for invoice payment. CAN I PAY VIA INSTALMENT? Yes, you can pay via instalments at checkout. HOW TO TAKE ONLINE CLASSES FROM HOME? Our platform provides easy and comfortable access for all learners; all you need is a stable internet connection and a device such as a laptop, desktop PC, tablet, or mobile phone. The learning site is accessible 24/7, allowing you to take the course at your own pace while relaxing in the privacy of your home or workplace. DOES AGE MATTER IN ONLINE LEARNING? No, there is no age limit for online learning. Online learning is accessible to people of all ages and requires no age-specific criteria to pursue a course of interest. As opposed to degrees pursued at university, online courses are designed to break the barriers of age limitation that aim to limit the learner's ability to learn new things, diversify their skills, and expand their horizons. WHEN I WILL GET THE LOGIN DETAILS FOR MY COURSE? After successfully purchasing the course, you will receive an email within 24 hours with the login details of your course. Kindly check your inbox, junk or spam folder, or you can contact our client success team via info@lead-academy.org

Flourish Studio Masterclass : Create Animated Visualisation
By Course Gate
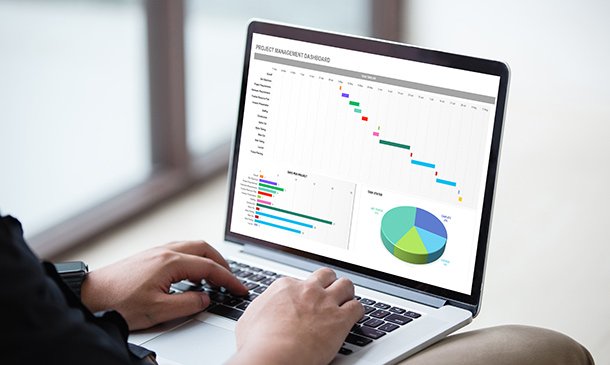
Take This Course * £175.00 £21.00 * 1 year * Intermediate * Course Certificate * Number of Units39 * Number of Quizzes0 * 3 hours, 27 minutes Gift this course * * * * COURSE OVERVIEW In this competitive job market, you need to have some specific skills and knowledge to start your career and establish your position. This Flourish Studio Masterclass : Create Animated Visualisation will help you understand the current demands, trends and skills in the sector. The course will provide you with the essential skills you need to boost your career growth in no time. The Flourish Studio Masterclass : Create Animated Visualisation will give you clear insight and understanding about your roles and responsibilities, job perspective and future opportunities in this field. You will be familiarised with various actionable techniques, career mindset, regulations and how to work efficiently. This course is designed to provide an introduction to Flourish Studio Masterclass : Create Animated Visualisation and offers an excellent way to gain the vital skills and confidence to work toward a successful career. It also provides access to proven educational knowledge about the subject and will support those wanting to attain personal goals in this area. LEARNING OBJECTIVES * Learn the fundamental skills you require to be an expert * Explore different techniques used by professionals * Find out the relevant job skills & knowledge to excel in this profession * Get a clear understanding of the job market and current demand * Update your skills and fill any knowledge gap to compete in the relevant industry * CPD accreditation for proof of acquired skills and knowledge WHO IS THIS COURSE FOR? Whether you are a beginner or an existing practitioner, our CPD accredited Flourish Studio Masterclass : Create Animated Visualisation is perfect for you to gain extensive knowledge about different aspects of the relevant industry to hone your skill further. It is also great for working professionals who have acquired practical experience but require theoretical knowledge with a credential to support their skill, as we offer CPD accredited certification to boost up your resume and promotion prospects. ENTRY REQUIREMENT Anyone interested in learning more about this subject should take this Flourish Studio Masterclass : Create Animated Visualisation. This course will help you grasp the basic concepts as well as develop a thorough understanding of the subject. The course is open to students from any academic background, as there is no prerequisites to enrol on this course. The course materials are accessible from an internet enabled device at anytime of the day. CPD CERTIFICATE FROM COURSE GATE At the successful completion of the course, you can obtain your CPD certificate from us. You can order the PDF certificate for £9 and the hard copy for £15. Also, you can order both PDF and hardcopy certificates for £22. CAREER PATH The Flourish Studio Masterclass : Create Animated Visualisation will help you to enhance your knowledge and skill in this sector. After accomplishing this course, you will enrich and improve yourself and brighten up your career in the relevant job market. COURSE CURRICULUM Introduction to Flourish Studio Welcome 00:04:00 Flourish Studio Background Story 00:01:00 Features of Flourish Studio 00:02:00 Flourish Studio Plans (Free, Business, Enterprise) 00:02:00 Getting Started with Flourish Signing up 00:02:00 Home Page Interface Walkthrough 00:06:00 Creating our First Flourish Visualisation 00:04:00 Adding and Managing Data in Flourish Templates Managing Data in Visualisations 00:08:00 Column Bindings 00:06:00 Merge Datasets 00:07:00 Creating Visualisations in Flourish Studio from scratch Creating a Bar or Line Chart in Flourish Studio - First Steps 00:08:00 Changing Settings to update Chart's look and feel - 1 00:21:00 Changing Settings to update Chart's look and feel - 2 00:10:00 Changing Settings to update Chart's look and feel - 3 00:12:00 More Visualisation Templates in Flourish Studio Table Charts (including mini visualisations) 00:09:00 Creating a Hierarchy Visualisation 00:05:00 Scatter Plot 00:06:00 More interesting variations of Scatter Plot 00:04:00 Map & Projection Charts + 3D Maps 00:08:00 Survey Charts 00:07:00 Gantt Chart 00:06:00 Radar Chart in Flourish Studio 00:06:00 Creating a Story and other Options How to create a Story in Flourish 00:13:00 Exporting, Publishing and Sharing 00:05:00 Flourish's Embed Options 00:06:00 How to Delete Projects 00:02:00 Other Exciting and Important Features Controlling access to Visualisations and stories with different Account Types 00:03:00 How to create a video or GIF from Flourish Visualisation/Story 00:04:00 How to generate the thumbnail of your visualisation 00:02:00 Customise colours in Flourish palettes 00:02:00 How to show published projects on your profile page 00:03:00 How to colour parts of your text with custom HTML 00:03:00 Add Social icons in Footer 00:02:00 Data Visualisation Tips & Resources How to select the right Visualisation Template 00:05:00 Dashboard Development Best Practices 00:04:00 Sources to get Datasets to use in Visualisations 00:02:00 Useful Resources to get Help & Continue Learning 00:06:00 Congratulations Congratulations on Course Completion 00:01:00 Certificate and Transcript Order Your Certificates or Transcripts 00:00:00

Dive deep into the world of spreadsheet mastery with our 'Data Analysis, Automating and Visualisation in Excel' course. This comprehensive programme takes you on a transformative journey from the rudiments of worksheet modifications to the advanced arts of data forecasting. Within each module, you'll unveil the secrets behind efficient list management, compelling visualisations, and the magic of PivotTables, among many other features. Moreover, automation isn't left behind; it's the heart and soul, making your workbook a living entity that breathes efficiency. By the end, you'll not only be fluent in Excel's vast toolkit but also possess the flair to present data in engaging, insightful ways. Learning Outcomes: 1. Master the art of efficient worksheet modification and effective list management. 2. Harness the power of data analysis tools to make informed decisions. 3. Craft compelling visuals using charts, Sparklines, and data mapping techniques. 4. Implement PivotTables and PivotCharts to dissect complex data sets effortlessly. 5. Automate workbook functionalities for optimised and streamlined processes. Video Player https://studyhub.org.uk/wp-content/uploads/2021/03/Data-Analysis-Automating-and-Visualisation-in-Excel.mp4 00:00 00:00 00:00 Use Up/Down Arrow keys to increase or decrease volume. WHY BUY THIS DATA ANALYSIS, AUTOMATING AND VISUALISATION IN EXCEL? 1. Unlimited access to the course for a lifetime. 2. Opportunity to earn a certificate accredited by the CPD Quality Standards after completing this course. 3. Structured lesson planning in line with industry standards. 4. Immerse yourself in innovative and captivating course materials and activities. 5. Assessments are designed to evaluate advanced cognitive abilities and skill proficiency. 6. Flexibility to complete the Data Analysis, Automating and Visualisation in Excel Course at your own pace, on your own schedule. 7. Receive full tutor support throughout the week, from Monday to Friday, to enhance your learning experience WHO IS THIS DATA ANALYSIS, AUTOMATING AND VISUALISATION IN EXCEL COURSE FOR? * Individuals looking to enhance their data visualisation and analysis prowess. * Managers wanting a streamlined approach to handling large datasets. * Academic researchers aiming to present their data in a more compelling format. * Finance professionals seeking efficient ways to dissect and forecast financial data. * Marketing strategists aiming to leverage data for improved decision-making. CAREER PATH * Data Analyst: £30,000 - £50,000 per annum * Financial Analyst: £35,000 - £55,000 per annum * Market Research Analyst: £28,000 - £45,000 per annum * Business Intelligence Analyst: £32,000 - £56,000 per annum * Operations Analyst: £30,000 - £52,000 per annum * Research Scientist (Data-oriented): £35,000 - £60,000 per annum PREREQUISITES This Data Analysis, Automating and Visualisation in Excel does not require you to have any prior qualifications or experience. You can just enrol and start learning.This Data Analysis, Automating and Visualisation in Excel was made by professionals and it is compatible with all PC's, Mac's, tablets and smartphones. You will be able to access the course from anywhere at any time as long as you have a good enough internet connection. CERTIFICATION After studying the course materials, there will be a written assignment test which you can take at the end of the course. After successfully passing the test you will be able to claim the pdf certificate for £4.99 Original Hard Copy certificates need to be ordered at an additional cost of £8. COURSE CURRICULUM Modifying a Worksheet Insert, Delete, and Adjust Cells, Columns, and Rows 00:10:00 Search for and Replace Data 00:09:00 Use Proofing and Research Tools 00:07:00 Working with Lists Sort Data 00:10:00 Filter Data 00:10:00 Query Data with Database Functions 00:09:00 Outline and Subtotal Data 00:09:00 Analyzing Data Apply Intermediate Conditional Formatting 00:07:00 Apply Advanced Conditional Formatting 00:05:00 Visualizing Data with Charts Create Charts 00:13:00 Modify and Format Charts 00:12:00 Use Advanced Chart Features 00:12:00 Using PivotTables and PivotCharts Create a PivotTable 00:13:00 Analyze PivotTable Data 00:12:00 Present Data with PivotCharts 00:07:00 Filter Data by Using Timelines and Slicers 00:11:00 Working with Multiple Worksheets and Workbooks Use Links and External References 00:12:00 Use 3-D References 00:06:00 Consolidate Data 00:05:00 Using Lookup Functions and Formula Auditing Use Lookup Functions 00:12:00 Trace Cells 00:09:00 Watch and Evaluate Formulas 00:08:00 Automating Workbook Functionality Apply Data Validation 00:13:00 Search for Invalid Data and Formulas with Errors 00:04:00 Work with Macros 00:18:00 Creating Sparklines and Mapping Data Create Sparklines 00:07:00 MapData 00:07:00 Forecasting Data Determine Potential Outcomes Using Data Tables 00:08:00 Determine Potential Outcomes Using Scenarios 00:09:00 Use the Goal Seek Feature 00:04:00 Forecasting Data Trends 00:05:00 Assignment Assignment - Data Analysis, Automating and Visualisation in Excel 00:00:00
Big Data : Data Science, Data Analytics & Data Visualisation
By NextGen Learning
Are you ready to embark on an enlightening journey of wisdom with the Big Data bundle, and pave your way to an enriched personal and professional future? If so, then Step into a world of knowledge with our course bundle - Big Data : Data Science, Data Analytics & Data Visualisation. Delve into eight immersive CPD Accredited courses, each a standalone course: 1. Big Data Analytics with PySpark Power BI and MongoDB 2. Big Data Analytics with PySpark Tableau Desktop and MongoDB 3. Building Big Data Pipelines with PySpark MongoDB and Bokeh 4. Develop Big Data Pipelines with R & Sparklyr & Tableau 5. Develop Big Data Pipelines with R, Sparklyr & Power BI 6. Basic Data Analysis 7. SQL for Data Science, Data Analytics and Data Visualization 8. Complete Python Machine Learning & Data Science Fundamentals Traverse the vast landscapes of theory, unlocking new dimensions of understanding at every turn. Let the Big Data : Data Science, Data Analytics & Data Visualisation bundle illuminate your path to wisdom. The Big Data : Data Science, Data Analytics & Data Visualisation bundle offers a comprehensive exploration into a rich tapestry of vast knowledge across eight carefully curated courses. The journey is designed to enhance your understanding and critical thinking skills. Each course within the bundle provides a deep-dive into complex theories, principles, and frameworks, allowing you to delve into the nuances of the subject matter at your own pace. In the framework of the Big Data : Data Science, Data Analytics & Data Visualisation package, you are bestowed with complimentary PDF certificates for all the courses included in this bundle, all without any additional charge. Adorn yourself with the Big Data bundle, empowering you to traverse your career trajectory or personal growth journey with self-assurance. Register today and ignite the spark of your professional advancement! So, don't wait further and join the Big Data : Data Science, Data Analytics & Data Visualisation community today and let your voyage of discovery begin! Learning Outcomes: * Attain a holistic understanding in the designated areas of study with the Big Data bundle. * Establish robust bases across each course nestled within the Big Data bundle. * Decipher intricate concepts through the articulate content of the Big Data bundle. * Amplify your prowess in interpreting, scrutinising, and implementing theories. * Procure the capacity to engage with the course material on an intellectual and profound level. * Become proficient in the art of problem-solving across various disciplines. Stepping into the Big Data bundle is akin to entering a world overflowing with deep theoretical wisdom. Each course within this distinctive bundle is an individual journey, meticulously crafted to untangle the complex web of theories, principles, and frameworks. Learners are inspired to explore, question, and absorb, thus enhancing their understanding and honing their critical thinking skills. Each course invites a personal and profoundly enlightening interaction with knowledge. The Big Data bundle shines in its capacity to cater to a wide range of learning needs and lifestyles. It gives learners the freedom to learn at their own pace, forging a unique path of discovery. More than just an educational journey, the Big Data bundle fosters personal growth, enabling learners to skillfully navigate the complexities of the world. The Big Data bundle also illuminates the route to a rewarding career. The theoretical insight acquired through this bundle forms a strong foundation for various career opportunities, from academia and research to consultancy and programme management. The profound understanding fostered by the Big Data bundle allows learners to make meaningful contributions to their chosen fields. Embark on the Big Data journey and let knowledge guide you towards a brighter future. CPD 85 CPD hours / points Accredited by CPD Quality Standards WHO IS THIS COURSE FOR? * Individuals keen on deepening their firm understanding in the respective fields. * Students pursuing higher education looking for comprehensive theory modules. * Professionals seeking to refresh or enhance their knowledge. * Anyone with a thirst for knowledge and a passion for continuous learning. CAREER PATH Armed with the Big Data bundle, your professional journey can reach new heights. The comprehensive theoretical knowledge from this bundle can unlock diverse career opportunities across several fields. Whether it's academic research, consultancy, or programme management, the Big Data bundle lays a solid groundwork. CERTIFICATES CPD CERTIFICATE OF COMPLETION Digital certificate - Included 8 Digital Certificates Are Included With This Bundle CPD QUALITY STANDARD HARDCOPY CERTIFICATE (FREE UK DELIVERY) Hard copy certificate - £9.99 Hardcopy Transcript - £9.99
Webinar - Full Recording This webinar will provide an interactive overview on the use of experiential imagery and visualisation techniques in the treatment of anxiety, depression, trauma and suicide management. 1. OVERVIEW 2. Imagery and Thinking 3. Activation and Consolidation 4. TREATMENT 5. Basic imagery techniques for all clients 6. Imagery Techniques for anxiety, depression and anger 7. Imagery Techniques for PTSD 8. Imagery techniques for Compassion Focused Therapy 9. Imagery Techniques in Suicide prevention 10. Implementation for your practice. 11. Imagery techniques applied to ourselves as therapists 12. Summary What is the workshop about? This workshop will cover the the role of imagery in maintaining psychological distress and the use of visualisation-based techniques in therapeutic practice. There will be practical demonstrations and the opportunity to apply key techniques to therapists ourselves. Who should attend? This workshop is aimed at therapists, counsellors, advisers, educationalists, health care workers, social workers and students in these areas. It is particularly useful for counsellors who do not normally work within a cognitive or behavioural model but want to explore tried and tested techniques. Similarly, counsellors and therapists working within this tradition are likely to find this workshop a useful refresher in the latest approaches. It is also suitable for anyone with an interest in contemporary practice in this area. What have previous delegates said about this workshop? * Particularly interesting to apply visualisation techniques to ourselves as therapists. * Excellent . Very interesting .Thank you . * I am newly qualified and though I have used imagery before, my experience is not that broad, so this was very helpful to understand how useful it can be across different disorders and also for me as a therapist. * Excellent pacing, very resourceful and easy to understand. Lots of practical ideas to use for practice. Thank you! * I loved this workshop, it was informative and give me more ideas as to how to use imagery. I feel more confident about using imagery in my role * Informative, good ideas * Engaging, well paced and informative. I'm a qualified CBT therapist and found this really increased my knowledge giving particular skills and ways of delivering. * Very enjoyable and informative. I got new ideas for use of visualisation work with clients and also for my own self reflection. Thank you! * This was a very informative workshop. I will use it in my practice * I found it great, and I have used visualisation in a small way but feel I can approach with more confidence. Resources A full set of slides with extensive clickable links to online resources, is sent free to all delegates after the event. This also includes references to key sources. Who is leading this webinar? Professor Patrick McGhee is a CBT therapist, psychologist and UK National Teaching Fellow. Educated at the universities of Glasgow and Oxford, he has completed CPD programmes at Harvard Business School and Ashridge. In 2017 he was a Visiting Fellow/Scholar at the universities of Cornell, Yale and MIT in the USA. He has taught, researched or practised in psychology and therapy for 30 years. His first post was a Research Fellow in Psychiatry and Psychology at St George's Hospital Medical School, University of London. He is the author of Thinking Psychologically (Palgrave) and co-editor of Accounting for Relationships (Methuen). He is an occasional columnist for the Guardian, the BBC and the Times Higher. He currently works in private practice in Greater Manchester. He has full accreditation from the British Association for Behavioural and Cognitive Psychotherapists.

Reducing Stress with Meditation and Visualisation
By OnlineCoursesLearning.com
REDUCE STRESS - MEDITATION AND VISUALISATION CERTIFICATION Figuring out how to decrease pressure utilizing reflection and perception is significant for everybody today. As the speed of present day life increments, so does our pressure, and figuring out how to manage it appropriately makes you more joyful and more profitable. This course gives a complete knowledge into both the reflection and perception methods you need, to lessen your feelings of anxiety; why they work, how they work and, in particular, how you can utilize them for your potential benefit. From the full definition and advantages of perception and reflection to incredible methods for you to accomplish full unwinding, this course covers all you require to think about lessening pressure through contemplation and representation. You will Learn The full definitions and advantages of both representation and contemplation; Successful thoughtful procedures and styles to assist you with lessening pressure; Step by step instructions to effectively utilize perception to accomplish unwinding; Step by step instructions to outfit the de-focusing on force of MettÄ Meditation, which joins contemplation and representation; Every one of the means you need to take, to effectively utilize reflection and representation, to lessen pressure. Advantages of taking this Course You will actually want to deal with a distressing circumstance; You will improve your connections at home and at work; You will figure out how to be more beneficial, because of managing pressure; You will figure out how to apply incredible and flexible reflection and representation procedures; You will be more joyful, more loose and totally settled in your life;

Are you ready to be at the helm, steering the ship into a realm where data is the new gold? In the infinite world of data, where information spirals at breakneck speed, lies a universe rich in potential and discovery: the domain of Data Science and Visualisation. This 'Certificate in Data Science and Visualisation with Machine Learning at QLS Level 3' course unravels the wonders of extracting meaningful insights using Python, the worldwide leading language of data experts. Harnessing the strength of Python, you'll delve deep into data analysis, experience the finesse of visualisation tools, and master the art of Machine Learning. The need to understand, interpret, and act on this data has become paramount, with vast amounts of data increasing the digital sphere. Envision a canvas where raw numbers are transformed into visually compelling stories, and machine learning models foretell future trends. This course provides a meticulous pathway for anyone eager to learn the data representation paradigms backed by Python's robust libraries. Dive into a curriculum rich with analytical explorations, visual artistry, and machine learning predictions. LEARNING OUTCOMES * Understanding the foundations and functionalities of Python, focusing on its application in data science. * Applying various Python libraries like NumPy and Pandas for effective data analysis. * Demonstrating proficiency in creating detailed visual narratives using tools like matplotlib, Seaborn, and Plotly. * Implementing Machine Learning algorithms in Python using scikit-learn, ranging from regression models to clustering techniques. * Designing and executing a holistic data analysis and visualisation project, encapsulating all learned techniques. * Exploring advanced topics, encompassing recommender systems and natural language processing with Python. * Attaining the confidence to independently analyse complex data sets and translate them into actionable insights. Video Player https://studyhub.org.uk/wp-content/uploads/2021/03/Data-Science-and-Visualisation-with-Machine-Learning.mp4 00:00 00:00 00:00 Use Up/Down Arrow keys to increase or decrease volume. WHY BUY THIS CERTIFICATE IN DATA SCIENCE AND VISUALISATION WITH MACHINE LEARNING AT QLS LEVEL 3? 1. Unlimited access to the course for a lifetime. 2. Opportunity to earn a certificate accredited by the CPD Quality Standards after completing this course. 3. Structured lesson planning in line with industry standards. 4. Immerse yourself in innovative and captivating course materials and activities. 5. Assessments are designed to evaluate advanced cognitive abilities and skill proficiency. 6. Flexibility to complete the Certificate in Data Science and Visualisation with Machine Learning at QLS Level 3 Course at your own pace, on your own schedule. 7. Receive full tutor support throughout the week, from Monday to Friday, to enhance your learning experience. WHO IS THIS CERTIFICATE IN DATA SCIENCE AND VISUALISATION WITH MACHINE LEARNING AT QLS LEVEL 3 COURSE FOR? * Aspiring data scientists aiming to harness the power of Python. * Researchers keen to enrich their analytical and visualisation skills. * Analysts aiming to add machine learning to their toolkit. * Developers striving to integrate data analytics into applications. * Business professionals desiring data-driven decision-making capabilities. CAREER PATH * Data Scientist: £55,000 - £85,000 Per Annum * Machine Learning Engineer: £60,000 - £90,000 Per Annum * Data Analyst: £30,000 - £50,000 Per Annum * Data Visualisation Specialist: £45,000 - £70,000 Per Annum * Natural Language Processing Specialist: £65,000 - £95,000 Per Annum * Business Intelligence Developer: £40,000 - £65,000 Per Annum PREREQUISITES This Certificate in Data Science and Visualisation with Machine Learning at QLS Level 3 does not require you to have any prior qualifications or experience. You can just enrol and start learning. This Certificate in Data Science and Visualisation with Machine Learning at QLS Level 3 was made by professionals and it is compatible with all PC's, Mac's, tablets and smartphones. You will be able to access the course from anywhere at any time as long as you have a good enough internet connection. CERTIFICATION After studying the course materials, there will be a written assignment test which you can take at the end of the course. After successfully passing the test you will be able to claim the pdf certificate for £4.99 Original Hard Copy certificates need to be ordered at an additional cost of £8. Endorsed Certificate of Achievement from the Quality Licence Scheme Learners will be able to achieve an endorsed certificate after completing the course as proof of their achievement. You can order the endorsed certificate for only £85 to be delivered to your home by post. For international students, there is an additional postage charge of £10. Endorsement The Quality Licence Scheme (QLS) has endorsed this course for its high-quality, non-regulated provision and training programmes. The QLS is a UK-based organisation that sets standards for non-regulated training and learning. This endorsement means that the course has been reviewed and approved by the QLS and meets the highest quality standards. Please Note: Studyhub is a Compliance Central approved resale partner for Quality Licence Scheme Endorsed courses. COURSE CURRICULUM Welcome, Course Introduction & overview, and Environment set-up Welcome & Course Overview 00:07:00 Set-up the Environment for the Course (lecture 1) 00:09:00 Set-up the Environment for the Course (lecture 2) 00:25:00 Two other options to setup environment 00:04:00 Python Essentials Python data types Part 1 00:21:00 Python Data Types Part 2 00:15:00 Loops, List Comprehension, Functions, Lambda Expression, Map and Filter (Part 1) 00:16:00 Loops, List Comprehension, Functions, Lambda Expression, Map and Filter (Part 2) 00:20:00 Python Essentials Exercises Overview 00:02:00 Python Essentials Exercises Solutions 00:22:00 Python for Data Analysis using NumPy What is Numpy? A brief introduction and installation instructions. 00:03:00 NumPy Essentials - NumPy arrays, built-in methods, array methods and attributes. 00:28:00 NumPy Essentials - Indexing, slicing, broadcasting & boolean masking 00:26:00 NumPy Essentials - Arithmetic Operations & Universal Functions 00:07:00 NumPy Essentials Exercises Overview 00:02:00 NumPy Essentials Exercises Solutions 00:25:00 Python for Data Analysis using Pandas What is pandas? A brief introduction and installation instructions. 00:02:00 Pandas Introduction 00:02:00 Pandas Essentials - Pandas Data Structures - Series 00:20:00 Pandas Essentials - Pandas Data Structures - DataFrame 00:30:00 Pandas Essentials - Handling Missing Data 00:12:00 Pandas Essentials - Data Wrangling - Combining, merging, joining 00:20:00 Pandas Essentials - Groupby 00:10:00 Pandas Essentials - Useful Methods and Operations 00:26:00 Pandas Essentials - Project 1 (Overview) Customer Purchases Data 00:08:00 Pandas Essentials - Project 1 (Solutions) Customer Purchases Data 00:31:00 Pandas Essentials - Project 2 (Overview) Chicago Payroll Data 00:04:00 Pandas Essentials - Project 2 (Solutions Part 1) Chicago Payroll Data 00:18:00 Python for Data Visualization using matplotlib Matplotlib Essentials (Part 1) - Basic Plotting & Object Oriented Approach 00:13:00 Matplotlib Essentials (Part 2) - Basic Plotting & Object Oriented Approach 00:22:00 Matplotlib Essentials (Part 3) - Basic Plotting & Object Oriented Approach 00:22:00 Matplotlib Essentials - Exercises Overview 00:06:00 Matplotlib Essentials - Exercises Solutions 00:21:00 Python for Data Visualization using Seaborn Seaborn - Introduction & Installation 00:04:00 Seaborn - Distribution Plots 00:25:00 Seaborn - Categorical Plots (Part 1) 00:21:00 Seaborn - Categorical Plots (Part 2) 00:16:00 Seborn-Axis Grids 00:25:00 Seaborn - Matrix Plots 00:13:00 Seaborn - Regression Plots 00:11:00 Seaborn - Controlling Figure Aesthetics 00:10:00 Seaborn - Exercises Overview 00:04:00 Seaborn - Exercise Solutions 00:19:00 Python for Data Visualization using pandas Pandas Built-in Data Visualization 00:34:00 Pandas Data Visualization Exercises Overview 00:03:00 Panda Data Visualization Exercises Solutions 00:13:00 Python for interactive & geographical plotting using Plotly and Cufflinks Plotly & Cufflinks - Interactive & Geographical Plotting (Part 1) 00:19:00 Plotly & Cufflinks - Interactive & Geographical Plotting (Part 2) 00:14:00 Plotly & Cufflinks - Interactive & Geographical Plotting Exercises (Overview) 00:11:00 Plotly & Cufflinks - Interactive & Geographical Plotting Exercises (Solutions) 00:37:00 Capstone Project - Python for Data Analysis & Visualization Project 1 - Oil vs Banks Stock Price during recession (Overview) 00:15:00 Project 1 - Oil vs Banks Stock Price during recession (Solutions Part 1) 00:18:00 Project 1 - Oil vs Banks Stock Price during recession (Solutions Part 2) 00:18:00 Project 1 - Oil vs Banks Stock Price during recession (Solutions Part 3) 00:17:00 Project 2 (Optional) - Emergency Calls from Montgomery County, PA (Overview) 00:03:00 Python for Machine Learning (ML) - scikit-learn - Linear Regression Model Introduction to ML - What, Why and Types.. 00:15:00 Theory Lecture on Linear Regression Model, No Free Lunch, Bias Variance Tradeoff 00:15:00 scikit-learn - Linear Regression Model - Hands-on (Part 1) 00:17:00 scikit-learn - Linear Regression Model Hands-on (Part 2) 00:19:00 Good to know! How to save and load your trained Machine Learning Model! 00:01:00 scikit-learn - Linear Regression Model (Insurance Data Project Overview) 00:08:00 scikit-learn - Linear Regression Model (Insurance Data Project Solutions) 00:30:00 Python for Machine Learning - scikit-learn - Logistic Regression Model Theory: Logistic Regression, conf. mat., TP, TN, Accuracy, Specificityetc. 00:10:00 scikit-learn - Logistic Regression Model - Hands-on (Part 1) 00:17:00 scikit-learn - Logistic Regression Model - Hands-on (Part 2) 00:20:00 scikit-learn - Logistic Regression Model - Hands-on (Part 3) 00:11:00 scikit-learn - Logistic Regression Model - Hands-on (Project Overview) 00:05:00 scikit-learn - Logistic Regression Model - Hands-on (Project Solutions) 00:15:00 Python for Machine Learning - scikit-learn - K Nearest Neighbors Theory: K Nearest Neighbors, Curse of dimensionality . 00:08:00 scikit-learn - K Nearest Neighbors - Hands-on 00:25:00 scikt-learn - K Nearest Neighbors (Project Overview) 00:04:00 scikit-learn - K Nearest Neighbors (Project Solutions) 00:14:00 Python for Machine Learning - scikit-learn - Decision Tree and Random Forests Theory: D-Tree & Random Forests, splitting, Entropy, IG, Bootstrap, Bagging. 00:18:00 scikit-learn - Decision Tree and Random Forests - Hands-on (Part 1) 00:19:00 scikit-learn - Decision Tree and Random Forests (Project Overview) 00:05:00 scikit-learn - Decision Tree and Random Forests (Project Solutions) 00:15:00 Python for Machine Learning - scikit-learn -Support Vector Machines (SVMs) Support Vector Machines (SVMs) - (Theory Lecture) 00:07:00 scikit-learn - Support Vector Machines - Hands-on (SVMs) 00:30:00 scikit-learn - Support Vector Machines (Project 1 Overview) 00:07:00 scikit-learn - Support Vector Machines (Project 1 Solutions) 00:20:00 scikit-learn - Support Vector Machines (Optional Project 2 - Overview) 00:02:00 Python for Machine Learning - scikit-learn - K Means Clustering Theory: K Means Clustering, Elbow method .. 00:11:00 scikit-learn - K Means Clustering - Hands-on 00:23:00 scikit-learn - K Means Clustering (Project Overview) 00:07:00 scikit-learn - K Means Clustering (Project Solutions) 00:22:00 Python for Machine Learning - scikit-learn - Principal Component Analysis (PCA) Theory: Principal Component Analysis (PCA) 00:09:00 scikit-learn - Principal Component Analysis (PCA) - Hands-on 00:22:00 scikit-learn - Principal Component Analysis (PCA) - (Project Overview) 00:02:00 scikit-learn - Principal Component Analysis (PCA) - (Project Solutions) 00:17:00 Recommender Systems with Python - (Additional Topic) Theory: Recommender Systems their Types and Importance 00:06:00 Python for Recommender Systems - Hands-on (Part 1) 00:18:00 Python for Recommender Systems - - Hands-on (Part 2) 00:19:00 Python for Natural Language Processing (NLP) - NLTK - (Additional Topic) Natural Language Processing (NLP) - (Theory Lecture) 00:13:00 NLTK - NLP-Challenges, Data Sources, Data Processing .. 00:13:00 NLTK - Feature Engineering and Text Preprocessing in Natural Language Processing 00:19:00 NLTK - NLP - Tokenization, Text Normalization, Vectorization, BoW. 00:19:00 NLTK - BoW, TF-IDF, Machine Learning, Training & Evaluation, Naive Bayes 00:13:00 NLTK - NLP - Pipeline feature to assemble several steps for cross-validation 00:09:00 Resources Resources - Data Science and Visualisation with Machine Learning 00:00:00 Order your QLS Endorsed Certificate Order your QLS Endorsed Certificate 00:00:00

Data Science & Machine Learning, Excel Pivot & Machine Learning with Python
(2)By Academy for Health and Fitness
***24 Hour Limited Time Flash Sale*** Data Science & Machine Learning, Excel Pivot & Machine Learning with Python Admission Gifts FREE PDF & Hard Copy Certificate| PDF Transcripts| FREE Student ID| Assessment| Lifetime Access| Enrolment Letter Immerse yourself in the world of Data Science, Machine Learning and Python with our exclusive bundle! Presenting eight thoughtfully curated courses, this bundle aims to enhance your understanding of intricate concepts. Within this collection, we proudly offer three QLS-endorsed courses: "2021 Data Science & Machine Learning with R from A-Z", "Excel Pivot Tables, Pivot Charts, Slicers, and Timelines", and "Machine Learning with Python", each complemented by a hardcopy certificate upon completion. Additionally, delve deeper with our five relevant CPD QS accredited courses. Explore Python Data Science with Numpy, Pandas, and Matplotlib. Uncover the secrets of R Programming for Data Science, enhance your statistical prowess with Statistics & Probability for Data Science & Machine Learning, and master spatial visualisation in Python. To top it all, there's a course on Google Data Studio for Data Analytics. Key Features of the Data Science & Machine Learning, Excel Pivot & Machine Learning with Python Bundle: * 3 QLS-Endorsed Courses: We proudly offer 3 QLS-endorsed courses within our Data Science & Machine Learning, Excel Pivot & Machine Learning with Python bundle, providing you with industry-recognized qualifications. Plus, you'll receive a free hardcopy certificate for each of these courses. * QLS Course 01: 2021 Data Science & Machine Learning with R from A-Z * QLS Course 02: Excel Pivot Tables, Pivot Charts, Slicers, and Timelines * QLS Course 03: Machine Learning with Python * 5 CPD QS Accredited Courses: Additionally, our bundle includes 5 relevant CPD QS accredited courses, ensuring that you stay up-to-date with the latest industry standards and practices. * Course 01: Python Data Science with Numpy, Pandas and Matplotlib * Course 02: R Programming for Data Science * Course 03: Statistics & Probability for Data Science & Machine Learning * Course 04: Spatial Data Visualisation and Machine Learning in Python * Course 05: Google Data Studio: Data Analytics * In Addition, you'll get Five Career Boosting Courses absolutely FREE with this Bundle. * Course 01: Professional CV Writing * Course 02: Job Search Skills * Course 03: Self-Esteem & Confidence Building * Course 04: Professional Diploma in Stress Management * Course 05: Complete Communication Skills Master Class * Convenient Online Learning: Our Data Science & Machine Learning, Excel Pivot & Machine Learning with Python courses are accessible online, allowing you to learn at your own pace and from the comfort of your own home. Learning Outcomes: * Master the usage of Excel Pivot Tables, Pivot Charts, Slicers, and Timelines. * Develop proficiency in Machine Learning using Python. * Acquire skills to manipulate data using Numpy, Pandas, and Matplotlib. * Learn to code in R for Data Science applications. * Understand the application of Statistics & Probability in Data Science & Machine Learning. * Learn to create impactful data visualisations and analyse data using Google Data Studio. The "Data Science & Machine Learning, Excel Pivot & Machine Learning with Python" bundle is a comprehensive compilation designed to equip you with the theoretical knowledge necessary for the fast-evolving data-driven world. The three QLS-endorsed courses provide foundational understanding in Data Science, Machine Learning with R, Excel Pivot functionalities, and Machine Learning with Python, thereby setting a strong base. Furthermore, the five CPD QS accredited courses offer a deeper dive into the world of Data Science. Whether it is harnessing Python's power for data science tasks, exploring R programming, mastering statistical techniques, understanding spatial data visualisation in Python, or learning to navigate Google Data Studio for Data Analytics, this bundle has you covered. With this comprehensive learning experience, gain the theoretical insight needed to navigate and succeed in the dynamic field of data science. CPD 250 CPD hours / points Accredited by CPD Quality Standards WHO IS THIS COURSE FOR? * Individuals interested in theoretical concepts of Data Science and Machine Learning. * Professionals looking to enhance their knowledge in Excel Pivot Tables and Charts. * Aspiring data scientists who want to learn Python and R programming for data science. * Anyone seeking to understand data visualisation and analytics through Python and Google Data Studio. CAREER PATH * Data Scientist: Leveraging data for actionable insights (£40,000 - £90,000 per annum). * Machine Learning Engineer: Designing and implementing machine learning systems (£50,000 - £90,000 per annum). * Excel Analyst: Using Excel for data analysis and visualisation (£30,000 - £60,000 per annum). * Python Developer: Developing applications using Python (£40,000 - £80,000 per annum). CERTIFICATES DIGITAL CERTIFICATE Digital certificate - Included HARD COPY CERTIFICATE Hard copy certificate - Included