6 Data Visualization courses in Banstead
Get a 10% discount on your first order when you use this promo code at checkout: MAY24BAN3X
OVERVIEW -------------------------------------------------------------------------------- Data and visual analytics are emerging fields concerned with analysing, modelling, and visualizing complex high-dimensional data. It can be analysed and visualised with many languages like Python, R Programming and more. This course will help to attain the skills and give in-depth knowledge to the participant's enhanced way of modelling, analysing and visualizing techniques. The course will highlight practical challenges including composite real-world data and will also comprise several practical studies
DMI Specialist Search
By London School of Science and Technology
The customer journey is changing faster than ever before. Can you keep up? Our brand-new Search Marketing course is here to get you ready – with the chance to learn directly from top SEO expert Neil Patel and his team. -------------------------------------------------------------------------------- COURSE OVERVIEW The customer journey is changing faster than ever before. Can you keep up? Our brand-new Search Marketing course is here to get you ready – with the chance to learn directly from top SEO expert Neil Patel and his team. Did you know that search marketing is currently one of the most in-demand roles? And that growth isn’t going to stop anytime soon. Develop true Search Marketing expertise for where search is now and where it’s going Program learning outcomes and content: What Will I Learn? Develop the skills to work in search right now. Learn about search engine optimization, paid search, and digital display advertising, along with the latest platforms including Google Ads, Microsoft Ads (Bing Ads), and Google Analytics 4. Study using a dynamic mix of interactive lessons, videos, and downloadable tools, along with live sessions on the latest trends and channels. You’ll be awarded with a DMI search marketing certification that’s recognized globally, along with a completion badge from Neil Patel. Course Content: Introduction to Search Marketing: Being found in the right place at the right time may look effortless but it’s an art. You’re going to need lots of key concepts, tools and tricks. Explore how the core search elements work together to drive targeted traffic that converts into sales. • Search Marketing • SEO & Paid Search principles • Demand generation • Analytics & reporting • Data visualization SEO Setup & Content: The search engine can feel all seeing, all knowing but it can be won over. SEO is the way to come out on top. Understanding the algorithms and ranking factors puts you in the driver’s seat. But that’s not all. What does it take to really engage people? Content that speaks to them. Find out what your audiences are looking for, create the content they care about, and then serve it to them where they are. The key to a big, visionary content strategy that works. • Setting SEO objectives • Keyword research • Creating content • On-page optimization • Content scheduling Optimizing SEO: Everyone wants to get their website in front of more people. The right people. That’s where search engine optimization comes in. There’s a lot to get a handle on with SEO, all working together to make your content more visible. Pick the quick wins, gather momentum, or optimize for a better return-on-investment. • SEO for eCommerce • Backlinking for authority • Local & international optimization • Off-page optimization Paid Search Fundamentals: So you know how to grow those organic searches and it’s going well. But you want to succeed faster. Cut right to the chase with paid search. Learn the fundamentals of PPC advertising and how it can work to promote your business. • Paid search concepts • Ads & landing pages • Keywords • Creating a paid search campaign Paid Search Campaigns: Now that you know the basics, it’s time to start running your campaigns. Use PPC advertising to boost your visibility. Discover how to measure and optimize your campaigns to get the best out of every single click. • Managing the campaign budget • Optimizing campaigns • Reporting on paid search Demand Generation: Capture interest wherever people are in their journey. Whether they’re a first time visitor, just getting to know you or coming back again and again. Demand generation gives you the tactics to drive awareness and long-term engagement. Sure, it takes time but it’s worth the payoff. • Demand generation campaigns • Outbound channels & ad formats • Campaign targeting & bidding • Optimizing your campaign • Involving display & video advertising Search Analytics: Search analytics can feel a bit like having a superpower. There’s so much you can know about what your target market is doing, what they want, how they speak. All of this data is at your fingertips, you just need to know how to use it. So let’s dive in. Plus with the shift to Google Analytics 4 daunting many businesses, we’ll get you set for success on the new interface. • Analytics fundamentals • Monitoring campaigns • Introduction to GA4 • Configuring Google Analytics • Conversion rate optimization Data& Data Visualization: Data gives us so many new insights and opportunities to work with. But we’re always looking for ways to make data more engaging, especially in a digital world where we have so much of it. Tell the story of what you’ve discovered with data visualization. It helps to communicate more effectively and bring everyone along for the journey. • Turning data into actions • Ways of visualizing data • Forecasting search performance Search Strategy - Research & Planning: So you have tools, techniques, and practiced skills. You’ve learned all of the stepping stones behind making search work hard. Now is your chance to get an action plan together. A strategic, focused plan that really delivers. One backed up by research and structured by set objectives. • Planning a search strategy • Research for search campaigns • Setting objectives for search Search Strategy 2 - Execution & Optimization It’s time to put everything you’ve learned into practice with a high-performing search marketing strategy. You have the skills, you’ve done the research, your action plan is prepared. Let’s execute the strategy and make it a reality. Exciting, isn’t it? • Omnichannel search approach • Adapting to change • Evaluating search strategies • Long term performance -------------------------------------------------------------------------------- DURATION 8-10 Weeks WHATS INCLUDED Course Material Case Study Experienced Lecturer Refreshments Certificate

Data Analysis and Visualization with Microsoft Excel
By Mpi Learning - Professional Learning And Development Provider
This course is designed for students who already have foundational knowledge and skills in Excel and who wish to perform robust and advanced data and statistical analysis with Microsoft Excel using PivotTables, use tools such as Power Pivot and the Data Analysis ToolPak to analyze data and visualize data and insights using advanced visualizations in charts and dashboards in Excel.

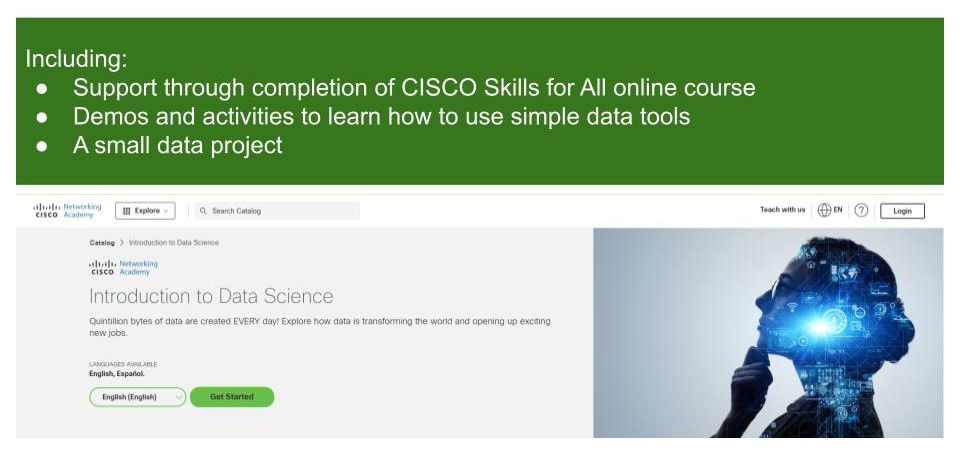
Introduction to Data Science
By futureCoders SE
Learn the basics of Data Science, combining a supported #CISCO Skills for All online course with practical learning and a project to help consolidate the learning.
Introduction to Data Science - free for Medway residents
By futureCoders SE
Learn the basics of Data Science, combining a supported #CISCO Skills for All online course with practical learning and a project to help consolidate the learning.
Power BI - dashboards (1 day) (In-House)
By The In House Training Company
Power BI is a powerful data visualisation program that allows businesses to monitor data, analyse trends, and make decisions. This course is designed to provide a solid understanding of the reporting side of Power BI, the dashboards, where administrators, and end users can interact with dynamic visuals that communicates information. This course focuses entirely on the creation and design of visualisations in dashboards, including a range of chart types, engaging maps, and different types of tables. Designing dashboards with KPI's (key performance indicators), heatmaps, flowcharts, sparklines, and compare multiple variables with trendlines. This one-day programme focuses entirely on creating dashboards, by using the many visualisation tools available in Power BI. You will learn to build dynamic, user-friendly interfaces in both Power BI Desktop and Power BI Service. 1 INTRODUCTION * Power BI ecosystem * Things to keep in mind * Selecting dashboard colours * Importing visuals into Power BI * Data sources for your analysis * Joining tables in Power BI 2 WORKING WITH DATA * Utilising a report theme * Table visuals * Matrix visuals * Drilling into hierarchies * Applying static filters * Group numbers with lists * Group numbers with bins 3 CREATING VISUALS * Heatmaps in Power BI * Visualising time-intelligence trends * Ranking categorical totals * Comparing proportions * View trends with sparklines 4 COMPARING VARIABLES * Insert key performance indicators (KPI) * Visualising trendlines as KPI * Forecasting with trendlines * Visualising flows with Sankey diagrams * Creating a scatter plot 5 MAPPING OPTIONS * Map visuals * Using a filled map * Mapping with latitude and longitude * Mapping with ArcGIS or ESRI 6 CREATING DASHBOARDS * High-level dashboard * Migration analysis dashboard * Adding slicers for filtering * Promote interaction with nudge prompts * Searching the dashboard with a slicer * Creating dynamic labels * Highlighting key points on the dashboard * Customised visualisation tooltips * Syncing slicers across pages 7 SHARING DASHBOARDS * Setting up and formatting phone views * Exporting data * Creating PDF files * Uploading to the cloud * Share dashboards in SharePoint online