7 Business Intelligence (BI) courses in Glasgow
Get a 10% discount on your first order when you use this promo code at checkout: MAY24BAN3X
QUERYING MICROSOFT SQL SERVER COURSE DESCRIPTION This course covers the technical skills required to write basic Transact-SQL queries for Microsoft SQL Server and provides the foundation for all SQL Server-related disciplines; namely, database administration, database development and business intelligence. This course helps prepare for exam 70-761. Note: This course is designed for SQL Server 2014or SQL Server 2016. WHAT WILL YOU LEARN * Write SELECT statements. * Create and implement views and table-valued functions. * Transform data by implementing pivot, unpivot, rollup and cube. * Create and implement stored procedures. * Add programming constructs such as variables, conditions, and loops to T-SQL code. QUERYING MICROSOFT SQL SERVER COURSE DETAILS * Who will benefit: Database administrators, database developers, and business intelligence professionals. SQL power users, namely, report writers, business analysts and client application developers. * Prerequisites: Database fundamentals * Duration 5 days QUERYING MICROSOFT SQL SERVER COURSE CONTENTS * Introduction to Microsoft SQL Server Management studio, creating and organizing T-SQL scripts, using books online. Hands on working with SQL Server tools. * T-SQL querying Introducing T-SQL, sets, predicate logic, logical order of operations in SELECT statements, basic SELECT statements, queries that filter data using predicates, queries that sort data using ORDER BY. Hands on introduction to T-SQL querying. * Writing SELECT queries Writing simple SELECT statements, eliminating duplicates with DISTINCT, column and table aliases, simple CASE expressions. Hands on writing basic SELECT statements. * Querying multiple tables cross joins and self joins, write queries that use Inner joins, write queries that use multiple-table inner joins, write queries that use self-joins, write queries that use outer joins, write queries that use cross joins. Hands on querying multiple tables. * Sorting and filtering data Sorting data, filtering data with predicates, filtering data with TOP and OFFSET-FETCH, working with unknown values, WHERE clause, ORDER BY clause, TOP option, OFFSET-FETCH clause. Hands on sorting and filtering data. * SQL Server data types Introducing SQL Server data types, Character data, date and time data, queries that return date and time data, write queries that use date and time functions, write queries that return character data, write queries that return character functions. Hands on working with SQL Server data types. * DML Adding data to tables, modifying and removing data, generating automatic column values, Inserting records with DML, updating and deleting records using DML. Hands on using DML to modify data. * Built-in functions Queries with built-in functions, conversion functions, logical functions, functions with NULL, queries that use conversion functions, queries that use logical functions, queries that test for nullability. Hands on built-in functions * Grouping and aggregating data Aggregate functions, the GROUP BY clause, filtering groups with HAVING, queries that use the GROUP BY clause, queries that use aggregate functions, queries that use distinct aggregate functions, queries that filter groups with the HAVING clause. Hands on grouping and aggregating data. * Subqueries Self-contained subqueries, correlated subqueries, EXISTS predicate with subqueries, scalar and multi-result subqueries. Hands on subqueries. * Table expressions Views, inline table-valued functions, derived tables, common table expressions. queries that use views, write queries that use derived tables, Common Table Expressions (CTEs), write queries that se inline Table valued expressions (TVFs). Hands on table expressions. * Set operators The UNION operator, EXCEPT and INTERSECT, APPLY, queries that use UNION set operators and UNION ALL, CROSS APPLY and OUTER APPLY operators. Hands on set operators. * Windows ranking, offset, and aggregate functions OVER, window functions, ranking functions, offset functions, window aggregate functions. Hands on; windows ranking, offset, and aggregate functions. * Pivoting and grouping sets PIVOT and UNPIVOT, grouping sets, queries that use the PIVOT operator, queries that use the UNPIVOT operator, queries that use the GROUPING SETS CUBE and ROLLUP subclauses. Hands on pivoting and grouping sets * Executing stored procedures Querying data with stored procedures, passing parameters to stored procedures, simple stored procedures, dynamic SQL, the EXECUTE statement to invoke stored procedures. Hands on executing stored procedures. * Programming with T-SQL T-SQL programming elements, controlling program flow, declaring variables and delimiting batches, control-of-flow elements, variables in a dynamic SQL statement, synonyms. Hands on programming with T-SQL * Error handling T-SQL error handling, structured exception handling, redirect errors with TRY/CATCH, THROW to pass an error message back to a client. Hands on implementing error handling. * Implementing transactions Transactions and the database engines, controlling transactions, BEGIN, COMMIT, and ROLLBACK, adding error handling to a CATCH block. Hands on implementing transactions.

Power BI Training
By FourSquare Innovations Ltd
FourSquare Training specialise in private, corporate Power BI courses delivered at your premises and tailored to your needs.
Hydrogen - Technology, Economics and Business Cases
By Asia Edge
ABOUT THIS VIRTUAL INSTRUCTOR LED TRAINING (VILT) Asia Pacific is set to be the largest and fastest growing Hydrogen market globally. This growth is driven by decarbonisation of energy-use, ammonia production and rising demand of fuel cell electric vehicles. Hydrogen as a fuel has outstanding energy carrying capacity and many application possibilities ranging from Petroleum refinery, Ammonia and Methanol production, Transportation and Power generation. Although the current petrochemical market segment will remain strongest in the near future, it is the transport and power sector which spurs the vision of a massive market takeoff in the next decade. The ever-rising share of renewable energies require flexible and scalable storage solutions, which in turn offers many additional revenue streams beyond pure electricity sales. Adding to this the strong impetus towards decarbonization of the transport sector from cars, trucks, trains to ships and even airplanes creates the breed for an exciting and yet untapped market potential. This course aims to clarify and assess the hydrogen business case along its value chain and versatile market applications. Training Objectives * Understanding current hydrogen market status and recent developments * Major drivers and inhibitors influencing the growth of the market * Understanding and comparing various production technology processes * Challenges and solutions in transport, distribution and storage of hydrogen * Mapping the many petrochemical, energy and transport applications * Analyse business cases from around the world and understand their economics Target Audience * Project developers * Equipment Manufacturers * Oil, Gas and Petrochemical sector companies * IPPs and utilities * Transport sector companies and port operators * Policy makers and regulators * Investors and lenders Course Level * Basic or Foundation Training Methods The VILT will be delivered online in 4 half-day sessions comprising 4 hours per day, including time for lectures, discussion, quizzes and short classroom exercises. Additionally, some self-study will be requested. Participants are invited but not obliged to bring a short presentation (10mins max) on a practical problem they encountered in their work. This will then be explained and discussed during the VILT. A short test or quiz will be held at the end the course. Trainer Your expert course leader is an internationally renowned energy communicator and business educator, focused on the interconnected clean energy transition topics of renewable power, energy storage, energy system electrification and hydrogen. His own independent technology tracking, market assessment and opportunity/risk analysis is delivered to clients through a mix of business advisory work, commissioned content, small-group training (online & in-person), and one-to-one executive coaching (online). In the hydrogen sector, he is currently lead consultant and trainer to the World Hydrogen Leaders network, and writer of their 'This Week in Hydrogen' news column. He is also co-presenter of the 'New Energy Chinwag' podcast, which regularly covers hydrogen-related issues. During more than 15 years as an independent energy expert, he has helped companies from large multinationals to innovative start-ups - totalling assignments in over 30 countries across 5 continents. Most recently, he has presented clean energy training in locations as diverse as Singapore, the UK, South Africa, The Philippines, the USA, Mexico, Spain and Dubai - and, in recent times of course, online to international audiences from across the world. Prior to this, he was Research Director for over 10 years at Informa, a $9 billion business intelligence provider; where he drove new market identification, analysis and project deployment work, and managed teams in the UK and US. He has a strong science background, holding a 1st Class Honours degree in Natural Sciences from the University of Cambridge, a PhD in Earth Sciences and a further Diploma in Economics & Sustainability from the UK's Open University. POST TRAINING COACHING SUPPORT (OPTIONAL) To further optimise your learning experience from our courses, we also offer individualized 'One to One' coaching support for 2 hours post training. We can help improve your competence in your chosen area of interest, based on your learning needs and available hours. This is a great opportunity to improve your capability and confidence in a particular area of expertise. It will be delivered over a secure video conference call by one of our senior trainers. They will work with you to create a tailor-made coaching program that will help you achieve your goals faster. Request for further information about post training coaching support and fees applicable for this. Accreditions And Affliations

Power BI - introduction to intermediate (2 days) (In-House)
By The In House Training Company
This course starts with the basics then moves seamlessly to an intermediate level. It includes a comprehensive yet balanced look at the four main components that make up Power BI Desktop: Report view, Data view, Model view, and the Power Query Editor. It also demonstrates how to use the online Power BI service. It looks at authoring tools that enables you to connect to and transform data from a variety of sources, allowing you to produce dynamic reports using a library of visualisations. Once you have those reports, the course looks at the seamless process of sharing those with your colleagues by publishing to the online Power BI service. The aim of this course is to provide a strong understanding of the Power BI analysis process, by working with real-world examples that will equip you with the necessary skills to start applying your knowledge straight away. 1 GETTING STARTED * The Power BI process * Launching Power BI Desktop * The four views of Power BI * Dashboard visuals 2 CONNECTING TO FILES * Connect to data sources * Connect to an Excel file * Connect to a CSV file * Connect to a database * Import vs. DirectQuery * Connect to a web source * Create a data table 3 TRANSFORMING DATA * The process of cleaning data * Column data types * Remove rows with filters * Add a custom column * Append data to a table * Fix error issues * Basic maths operations 4 BUILD A DATA MODEL * Table relationships * Manage table relationships 5 MERGE QUERIES * Table join kinds * Merging tables 6 CREATE REPORT VISUALISATIONS * Creating map visuals * Formatting maps * Creating chart visuals * Formatting chart * Tables, matrixes, and cards * Control formatting with themes * Filter reports with slicers * Reports for mobile devices * Custom online visuals * Export report data to Excel 7 THE POWER QUERY EDITOR * Fill data up and down * Split columns by delimiter * Add conditional columns * Merging columns 8 THE M FORMULA * Creating M functions * Create an IF function * Create a query group 9 PIVOT AND UNPIVOT TABLES * Pivot tables in the query editor * Pivot and append tables * Pivot but don't summarise * Unpivot tables * Append mismatched headers 10 DATA MODELLING REVISITED * Data model relationships * Mark a calendar as a date table 11 INTRODUCTION TO CALCULATED COLUMNS * New columns vs. measures * Creating a new column calculation * The SWITCH function 12 INTRODUCTION TO DAX MEASURES * Common measure categories * The SUM measure * Adding measures to visuals * COUNTROWS and DISINCTCOUNT functions * DAX rules 13 THE CALCULATE MEASURE * The syntax of CALCULATE * Things of note about CALCULATE 14 THE SUMX MEASURE * The SUMX measure * X iterator functions * Anatomy of SUMX 15 INTRODUCTION TO TIME INTELLIGENCE * Importance of a calendar table * A special lookup table * The TOTALYTD measure * Change year end in TOTALYTD 16 HIERARCHY, GROUPS AND FORMATTING * Create a hierarchy to drill data * Compare data in groups * Add conditional formatting 17 SHARE REPORTS ON THE WEB * Publish to the BI online service * Get quick insights * Upload reports from BI service * Exporting report data * What is Q&A? * Sharing your reports 18 APPLY YOUR LEARNING * Post training recap lesson

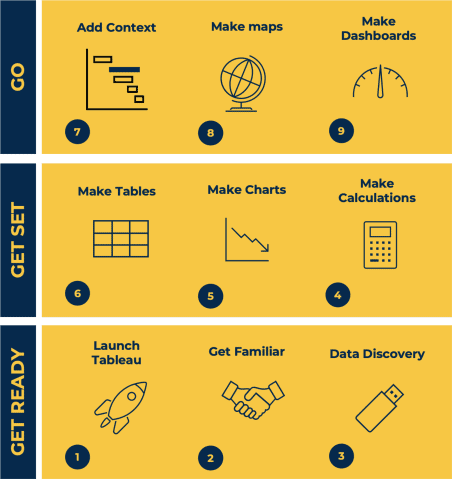
Tableau Desktop Training - Foundation
By Tableau Training Uk
This Tableau Desktop Training course is a jumpstart to getting report writers and analysts with little or no previous knowledge to being productive. It covers everything from connecting to data, through to creating interactive dashboards with a range of visualisations in two days of your time. -------------------------------------------------------------------------------- For Private options, online or in-person, please send us details of your requirements: -------------------------------------------------------------------------------- This Tableau Desktop Training course is a jumpstart to getting report writers and analysts with little or no previous knowledge to being productive. It covers everything from connecting to data, through to creating interactive dashboards with a range of visualisations in two days of your time. Having a quick turnaround from starting to use Tableau, to getting real, actionable insights means that you get a swift return on your investment of time and money. This accelerated approach is key to getting engagement from within your organisation so everyone can immediately see and feel the impact of the data and insights you create. This course is aimed at someone who has not used Tableau in earnest and may be in a functional role, eg. in sales, marketing, finance, operations, business intelligence etc. -------------------------------------------------------------------------------- THE COURSE IS SPLIT INTO 3 PHASES AND 9 MODULES: PHASE 1: GET READY MODULE 1: LAUNCH TABLEAU * Check Install & Setup * Why is Visual Analytics Important MODULE 2: GET FAMILIAR * What is possible * How does Tableau deal with data * Know your way around * How do we format charts * Dashboard Basics – My First Dashboard MODULE 3: DATA DISCOVERY * Connecting to and setting up data in Tableau * How Do I Explore my Data – Filters & Sorting * How Do I Structure my Data – Groups & Hierarchies, Visual Groups * How Tableau Deals with Dates – Using Discrete and Continuous Dates, Custom Dates PHASE 2: GET SET MODULE 4: MAKE CALCULATIONS * How Do I Create Calculated Fields & Why MODULE 5: MAKE CHARTS * Charts that Compare Multiple Measures – Measure Names and Measure Values, Shared Axis Charts, Dual Axis Charts, Scatter Plots * Showing Relational & Proportional Data – Pie Charts, Donut Charts, Tree Maps MODULE 6: MAKE TABLES * Creating Tables – Creating Tables, Highlight Tables, Heat Maps PHASE 3: GO MODULE 7: ADD CONTEXT * Reference Lines and Bands MODULE 8: MAKE MAPS * Answering Spatial Questions – Mapping, Creating a Choropleth (Filled) Map MODULE 9: MAKE DASHBOARDS * Using the Dashboard Interface * Dashboard Actions -------------------------------------------------------------------------------- This training course includes over 25 hands-on exercises and quizzes to help participants “learn by doing” and to assist group discussions around real-life use cases. Each attendee receives a login to our extensive training portal which covers the theory, practical applications and use cases, exercises, solutions and quizzes in both written and video format. Students must use their own laptop with an active version of Tableau Desktop 2018.2 (or later) pre-installed. -------------------------------------------------------------------------------- WHAT PEOPLE ARE SAYING ABOUT THIS COURSE “Excellent Trainer – knows his stuff, has done it all in the real world, not just the class room.” Richard L., Intelliflo “Tableau is a complicated and powerful tool. After taking this course, I am confident in what I can do, and how it can help improve my work.” Trevor B., Morrison Utility Services “I would highly recommend this course for Tableau beginners, really easy to follow and keep up with as you are hands on during the course. Trainer really helpful too.” Chelsey H., QVC “He is a natural trainer, patient and very good at explaining in simple terms. He has an excellent knowledge base of the system and an obvious enthusiasm for Tableau, data analysis and the best way to convey results. We had been having difficulties in the business in building financial reports from a data cube and he had solutions for these which have proved to be very useful.” Matthew H., ISS Group
Visual Analytics Best Practice
By Tableau Training Uk
This course is very much a discussion, so be prepared to present and critically analyse your own and class mates work. You will also need to bring a few examples of work you have done in the past. Learning and applying best practice visualisation principles will improve effective discussions amongst decision makers throughout your organisation. As a result more end-users of your dashboards will be able to make better decisions, more quickly. This 2 Day training course is aimed at analysts with good working knowledge of BI tools (we use Tableau to present, but attendees can use their own software such as Power BI or Qlik Sense). It is a great preparation for taking advanced certifications, such as Tableau Certified Professional. -------------------------------------------------------------------------------- Contact us to discuss the Visual Analytics Best Practice course Email us if you are interested in an on-site course, or would be interested in different dates and locations -------------------------------------------------------------------------------- This Tableau Desktop training intermediate course is designed for the professional who has a solid foundation with Tableau and is looking to take it to the next level. Attendees should have a good understanding of the fundamental concepts of building Tableau worksheets and dashboards typically achieved from having attended our Tableau Desktop Foundation Course. At the end of this course you will be able to communicate insights more effectively, enabling your organisation to make better decisions, quickly. The Tableau Desktop Analyst training course is aimed at people who are used to working with MS Excel or other Business Intelligence tools and who have preferably been using Tableau already for basic reporting. -------------------------------------------------------------------------------- THE COURSE INCLUDES THE FOLLOWING TOPICS: WHAT IS VISUAL ANALYSIS? * Visual Analytics * Visual Analytics Process * Advantages of Visual Analysis * Exercise: Interpreting Visualisations HOW DO WE PROCESS VISUAL INFORMATION? * Memory and Processing Types * Exercise: Identifying Types of Processing * Cognitive Load * Exercise: Analysing Cognitive Load * Focus and Guide the Viewer * Remove Visual Distractions * Organise Information into Chunks * Design for Proximity * Exercise: Reducing Cognitive Load SENSORY MEMORY * Pre-attentive Attributes * Quantitatively-Perceived Attributes * Categorically-Perceived Attributes * Exercise: Analysing Pre-attentive Attributes * Form & Attributes * Exercise: Using Form Effectively * Colour & Attributes * Exercise: Using Colour Effectively * Position & Attributes * Exercise: Using Position Effectively ENSURING VISUAL INTEGRITY * Informing without Misleading * Gestalt Principles * Visual Area * Axis & Scale * Colour * Detail * Exercise: Informing without Misleading CHOOSING THE RIGHT VISUALISATION * Comparing and Ranking Categories * Comparing Measures * Comparing Parts to Whole * Viewing Data Over Time * Charts Types for Mapping * Viewing Correlation * Viewing Distributions * Viewing Specific Values DASHBOARDS AND STORIES * Exercise: Picking the Chart Type * Exercise: Brainstorming Visual Best Practice * Development Process for Dashboards and Stories * Plan the Visualisation * Create the Visualisation * Test the Visualisation * Exercise: Designing Dashboards and Stories -------------------------------------------------------------------------------- This training course includes over 20 hands-on exercises to help participants “learn by doing” and to assist group discussions around real-life use cases. Each attendee receives an extensive training manual which covers the theory, practical applications and use cases, exercises and solutions together with a USB with all the materials required for the training. The course starts at 09:30 on the first day and ends at 17:00. On the second day the course starts at 09:00 and ends at 17:00. Students must bring their own laptop with an active version of Tableau Desktop 10.5 (or later) pre-installed. -------------------------------------------------------------------------------- WHAT PEOPLE ARE SAYING ABOUT THIS COURSE "Steve was willing to address questions arising from his content in a full and understandable way" Lisa L. "Really enjoyed the course and feel the subject and the way it was taught was very close to my needs" James G. "The course tutor Steve was incredibly helpful and taught the information very well while making the two days very enjoyable." Bradd P. "The host and his courses will give you the tools and confidence that you need to be comfortable with Tableau." Jack S. "Steve was fantastic with his knowledge and knowhow about the product. Where possible he made sure you could put demonstrations in to working practice, to give the audience a clear understanding." Tim H. "This was a very interesting and helpful course, which will definitely help me produce smarter, cleaner visualisations that will deliver more data-driven insights within our business." Richard A. "Steve is very open to questions and will go out of his way to answer any query. Thank you" Wasif N. "Steve was willing to address questions arising from his content in a full and understandable way" Lisa L. "Really enjoyed the course and feel the subject and the way it was taught was very close to my needs" James G.

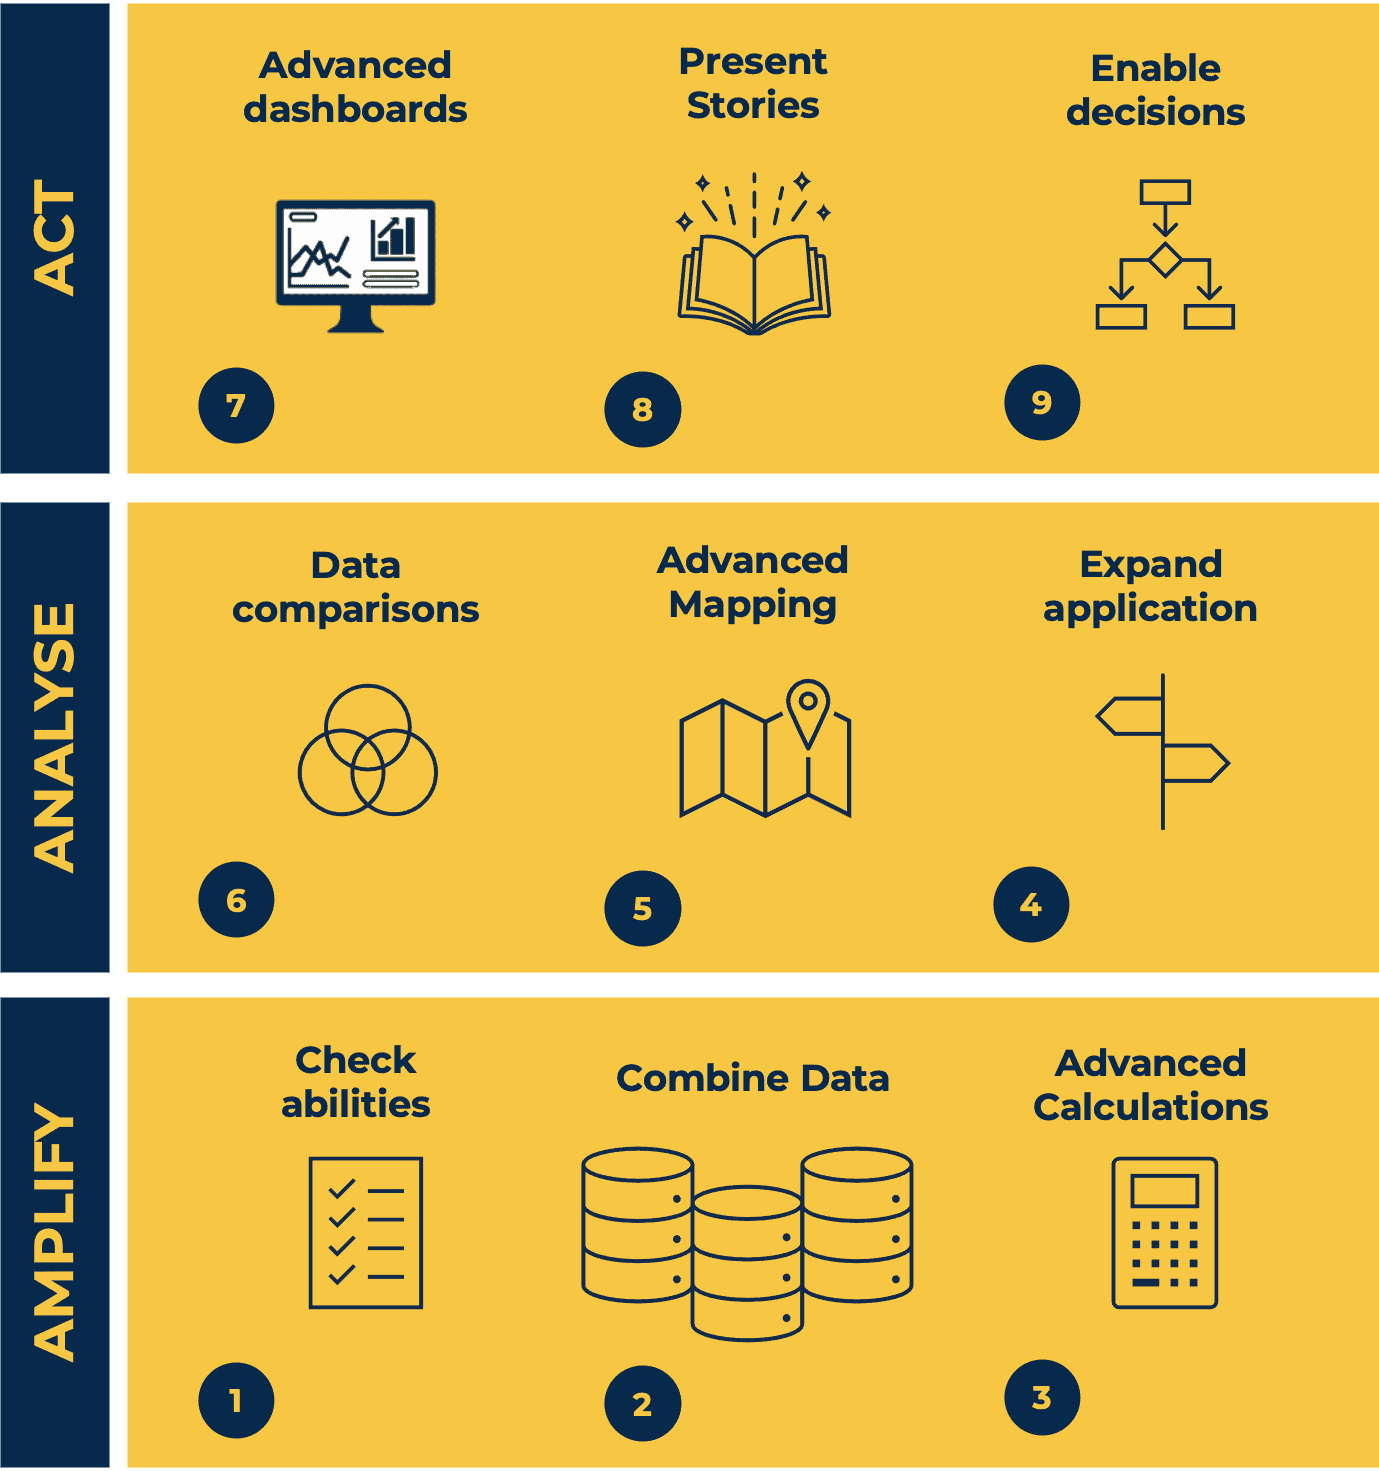
Tableau Desktop Training - Analyst
By Tableau Training Uk
This Tableau Desktop Training intermediate course is designed for the professional who has a solid foundation with Tableau and is looking to take it to the next level. -------------------------------------------------------------------------------- For Private options, online or in-person, please send us details of your requirements: -------------------------------------------------------------------------------- This Tableau Desktop training intermediate course is designed for the professional who has a solid foundation with Tableau and is looking to take it to the next level. Attendees should have a good understanding of the fundamental concepts of building Tableau worksheets and dashboards typically achieved from having attended our Tableau Desktop Foundation Course. At the end of this course you will be able to communicate insights more effectively, enabling your organisation to make better decisions, quickly. The Tableau Desktop Analyst training course is aimed at people who are used to working with MS Excel or other Business Intelligence tools and who have preferably been using Tableau already for basic reporting. -------------------------------------------------------------------------------- THE COURSE IS SPLIT INTO 3 PHASES AND 9 MODULES: PHASE 1: AMPLIFY MODULE 1: CHECK ABILITIES * Revision – What I Should Know * * What is possible * How does Tableau deal with data * Know your way around * How do we format charts * How Tableau deals with dates * Charts that compare multiple measures * Creating Tables MODULE 2: COMBINE DATA * Relationships * Joining Tables – Join Types, Joining tables within the same database, cross database joins, join calculations * Blending – How to create a blend with common fields, Custom defined Field relationships and mismatched element names, Calculated fields in blended data sources * Unions – Manual Unions and mismatched columns, Wildcard unions * Data Extracts – Creating & Editing Data extracts MODULE 3: ADVANCED CALCULATIONS * Row Level v Aggregations * Aggregating dimensions in calculations * Changing the Level of Detail (LOD) of calculations – What, Why, How * Adding Table Calculations PHASE 2: ANALYSE MODULE 4: EXPAND APPLICATION * Making things dynamic with parameters * Sets * Trend Lines * How do we format charts * Forecasting MODULE 5: ADVANCED MAPPING * Using your own images for spatial analysis * Mapping with Spatial files MODULE 6: DATA COMPARISONS Advanced Charts * Bar in Bar charts * Bullet graphs * Creating Bins and Histograms * Creating a Box & Whisker plot PHASE 3: ACT MODULE 7: ADVANCED DASHBOARDS * Using the dashboard interface and Device layout * Dashboard Actions and Viz In tooltips * Horizontal & Vertical containers * Navigate between dashboards MODULE 8: PRESENT STORIES * Telling data driven stories MODULE 9: ENABLE DECISIONS * What is Tableau Server * Publishing & Permissions * How can your users engage with content -------------------------------------------------------------------------------- This training course includes over 25 hands-on exercises and quizzes to help participants “learn by doing” and to assist group discussions around real-life use cases. Each attendee receives a login to our extensive training portal which covers the theory, practical applications and use cases, exercises, solutions and quizzes in both written and video format. Students must bring their own laptop with an active version of Tableau Desktop 2018.2 (or later) pre-installed. -------------------------------------------------------------------------------- WHAT PEOPLE ARE SAYING ABOUT THIS COURSE “Course was fantastic, and completely relevant to the work I am doing with Tableau. I particularly liked Steve’s method of teaching and how he applied the course material to ‘real-life’ use-cases.” Richard W., Dashboard Consulting Ltd “This course was extremely useful and excellent value. It helped me formalise my learning and I have taken a lot of useful tips away which will help me in everyday work.” Lauren M., Baillie Gifford “I would definitely recommend taking this course if you have a working knowledge of Tableau. Even the little tips Steve explains will make using Tableau a lot easier. Looking forward to putting what I’ve learned into practice.” Aron F., Grove & Dean “Steve is an excellent teacher and has a vast knowledge of Tableau. I learned a huge amount over the two days that I can immediately apply at work.” John B., Mporium “Steve not only provided a comprehensive explanation of the content of the course, but also allowed time for discussing particular business issues that participants may be facing. That was really useful as part of my learning process.” Juan C., Financial Conduct Authority “Course was fantastic, and completely relevant to the work I am doing with Tableau. I particularly liked Steve’s method of teaching and how he applied the course material to ‘real-life’ use-cases.” Richard W., Dashboard Consulting Ltd “This course was extremely useful and excellent value. It helped me formalise my learning and I have taken a lot of useful tips away which will help me in everyday work.” Lauren M., Baillie Gifford “I would definitely recommend taking this course if you have a working knowledge of Tableau. Even the little tips Steve explains will make using Tableau a lot easier. Looking forward to putting what I’ve learned into practice.” Aron F., Grove & Dean “Steve is an excellent teacher and has a vast knowledge of Tableau. I learned a huge amount over the two days that I can immediately apply at work.” John B., Mporium