Get a 10% discount on your first order when you use this promo code at checkout: MAY24BAN3X
Board Meeting Prep - Tips and Tools
By Ralph Ward
Board members face a huge amount of information and review before the board meeting. Here is step-by-step process for mastering your board meeting prep challenge.

Best Practice Board Meeting Tips
By Ralph Ward
For boards and staff, board meetings always involve too much time, too much effort, too much material to review, and too few tools to make governance effective. Here are the top tools, tips and timesavers boards around the world use to make your impossible boardroom tasks do-able.

Tableau Desktop Training - Foundation
By Tableau Training Uk
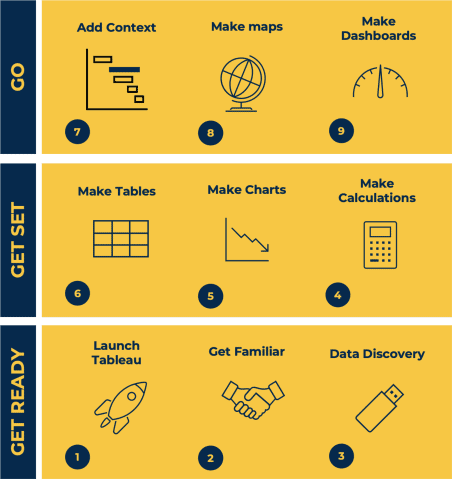
This Tableau Desktop Training course is a jumpstart to getting report writers and analysts with little or no previous knowledge to being productive. It covers everything from connecting to data, through to creating interactive dashboards with a range of visualisations in two days of your time. -------------------------------------------------------------------------------- For Private options, online or in-person, please send us details of your requirements: -------------------------------------------------------------------------------- This Tableau Desktop Training course is a jumpstart to getting report writers and analysts with little or no previous knowledge to being productive. It covers everything from connecting to data, through to creating interactive dashboards with a range of visualisations in two days of your time. Having a quick turnaround from starting to use Tableau, to getting real, actionable insights means that you get a swift return on your investment of time and money. This accelerated approach is key to getting engagement from within your organisation so everyone can immediately see and feel the impact of the data and insights you create. This course is aimed at someone who has not used Tableau in earnest and may be in a functional role, eg. in sales, marketing, finance, operations, business intelligence etc. -------------------------------------------------------------------------------- THE COURSE IS SPLIT INTO 3 PHASES AND 9 MODULES: PHASE 1: GET READY MODULE 1: LAUNCH TABLEAU * Check Install & Setup * Why is Visual Analytics Important MODULE 2: GET FAMILIAR * What is possible * How does Tableau deal with data * Know your way around * How do we format charts * Dashboard Basics – My First Dashboard MODULE 3: DATA DISCOVERY * Connecting to and setting up data in Tableau * How Do I Explore my Data – Filters & Sorting * How Do I Structure my Data – Groups & Hierarchies, Visual Groups * How Tableau Deals with Dates – Using Discrete and Continuous Dates, Custom Dates PHASE 2: GET SET MODULE 4: MAKE CALCULATIONS * How Do I Create Calculated Fields & Why MODULE 5: MAKE CHARTS * Charts that Compare Multiple Measures – Measure Names and Measure Values, Shared Axis Charts, Dual Axis Charts, Scatter Plots * Showing Relational & Proportional Data – Pie Charts, Donut Charts, Tree Maps MODULE 6: MAKE TABLES * Creating Tables – Creating Tables, Highlight Tables, Heat Maps PHASE 3: GO MODULE 7: ADD CONTEXT * Reference Lines and Bands MODULE 8: MAKE MAPS * Answering Spatial Questions – Mapping, Creating a Choropleth (Filled) Map MODULE 9: MAKE DASHBOARDS * Using the Dashboard Interface * Dashboard Actions -------------------------------------------------------------------------------- This training course includes over 25 hands-on exercises and quizzes to help participants “learn by doing” and to assist group discussions around real-life use cases. Each attendee receives a login to our extensive training portal which covers the theory, practical applications and use cases, exercises, solutions and quizzes in both written and video format. Students must use their own laptop with an active version of Tableau Desktop 2018.2 (or later) pre-installed. -------------------------------------------------------------------------------- WHAT PEOPLE ARE SAYING ABOUT THIS COURSE “Excellent Trainer – knows his stuff, has done it all in the real world, not just the class room.” Richard L., Intelliflo “Tableau is a complicated and powerful tool. After taking this course, I am confident in what I can do, and how it can help improve my work.” Trevor B., Morrison Utility Services “I would highly recommend this course for Tableau beginners, really easy to follow and keep up with as you are hands on during the course. Trainer really helpful too.” Chelsey H., QVC “He is a natural trainer, patient and very good at explaining in simple terms. He has an excellent knowledge base of the system and an obvious enthusiasm for Tableau, data analysis and the best way to convey results. We had been having difficulties in the business in building financial reports from a data cube and he had solutions for these which have proved to be very useful.” Matthew H., ISS Group
Value Stream Mapping Workshop
By Centre for Competitiveness
The fundamental tool to identify waste, create effective process flow, reduce process cycle times, and implement process improvement.

Power BI - introduction to intermediate (2 days) (In-House)
By The In House Training Company
This course starts with the basics then moves seamlessly to an intermediate level. It includes a comprehensive yet balanced look at the four main components that make up Power BI Desktop: Report view, Data view, Model view, and the Power Query Editor. It also demonstrates how to use the online Power BI service. It looks at authoring tools that enables you to connect to and transform data from a variety of sources, allowing you to produce dynamic reports using a library of visualisations. Once you have those reports, the course looks at the seamless process of sharing those with your colleagues by publishing to the online Power BI service. The aim of this course is to provide a strong understanding of the Power BI analysis process, by working with real-world examples that will equip you with the necessary skills to start applying your knowledge straight away. 1 GETTING STARTED * The Power BI process * Launching Power BI Desktop * The four views of Power BI * Dashboard visuals 2 CONNECTING TO FILES * Connect to data sources * Connect to an Excel file * Connect to a CSV file * Connect to a database * Import vs. DirectQuery * Connect to a web source * Create a data table 3 TRANSFORMING DATA * The process of cleaning data * Column data types * Remove rows with filters * Add a custom column * Append data to a table * Fix error issues * Basic maths operations 4 BUILD A DATA MODEL * Table relationships * Manage table relationships 5 MERGE QUERIES * Table join kinds * Merging tables 6 CREATE REPORT VISUALISATIONS * Creating map visuals * Formatting maps * Creating chart visuals * Formatting chart * Tables, matrixes, and cards * Control formatting with themes * Filter reports with slicers * Reports for mobile devices * Custom online visuals * Export report data to Excel 7 THE POWER QUERY EDITOR * Fill data up and down * Split columns by delimiter * Add conditional columns * Merging columns 8 THE M FORMULA * Creating M functions * Create an IF function * Create a query group 9 PIVOT AND UNPIVOT TABLES * Pivot tables in the query editor * Pivot and append tables * Pivot but don't summarise * Unpivot tables * Append mismatched headers 10 DATA MODELLING REVISITED * Data model relationships * Mark a calendar as a date table 11 INTRODUCTION TO CALCULATED COLUMNS * New columns vs. measures * Creating a new column calculation * The SWITCH function 12 INTRODUCTION TO DAX MEASURES * Common measure categories * The SUM measure * Adding measures to visuals * COUNTROWS and DISINCTCOUNT functions * DAX rules 13 THE CALCULATE MEASURE * The syntax of CALCULATE * Things of note about CALCULATE 14 THE SUMX MEASURE * The SUMX measure * X iterator functions * Anatomy of SUMX 15 INTRODUCTION TO TIME INTELLIGENCE * Importance of a calendar table * A special lookup table * The TOTALYTD measure * Change year end in TOTALYTD 16 HIERARCHY, GROUPS AND FORMATTING * Create a hierarchy to drill data * Compare data in groups * Add conditional formatting 17 SHARE REPORTS ON THE WEB * Publish to the BI online service * Get quick insights * Upload reports from BI service * Exporting report data * What is Q&A? * Sharing your reports 18 APPLY YOUR LEARNING * Post training recap lesson

Power BI - introduction (2 day) (In-House)
By The In House Training Company
There is a lot to learn in Power BI, this course takes a comprehensive look at the fundamentals of analysing data and includes a balanced look at the four main components that make up Power BI Desktop: Report view, Data view, Model view, and the Power Query Editor. It also demonstrates how to utilise the online Power BI service. It looks at authoring tools that enable you to connect to and transform data from a variety of sources, allowing you to produce detailed reports through a range of visualisations, in an interactive and dynamic way. It also includes a detailed look at formulas by writing both M functions in Power Query, and DAX functions in Desktop view. This knowledge will allow you to take your reports to the next level. The aim of this course is to provide a complete introduction to understanding the Power BI analysis process, by working hands-on with examples that will equip you with the necessary skills to start applying your learning straight away. 1 GETTING STARTED * The Power BI ecosystem * Opening Power BI Desktop * Power BI's four views * Introduction to Dashboards 2 IMPORTING FILES * Importing data sources * Importing an Excel file * Importing a CSV file * Importing a database * Connect to an SQL Server Database * Import vs. Direct Query * Importing from the web * Importing a folder of files * Managing file connections 3 SHAPE DATA IN THE QUERY EDITOR * The process of shaping data * Managing data types * Keeping and removing rows * Add a custom column * Appending tables together * Hiding queries in reports * Fixing error issues * Basic maths operations 4 THE DATA MODEL * Table relationships * Relationship properties 5 MERGE QUERIES * Table join kinds * Merging tables 6 INSERTING DASHBOARD VISUALS * Things to keep in mind * Inserting maps * Formatting Maps * Inserting charts * Formatting Charts * Inserting a tree map * Inserting a table, matrix, and card * Controlling number formats * About report themes * Highlighting key points * Filter reports with slicers * Sync slicers across dashboards * Custom web visuals 7 PUBLISH AND SHARE REPORTS * Publishing to Power BI service * Editing online reports * Pinning visuals to a dashboard * What is Q&A? * Sharing dashboards * Exporting reports to PowerPoint * Exporting reports as PDF files 8 THE POWER QUERY EDITOR * Fill data up and down * Split column by delimiter * Add a conditional column * More custom columns * Merging columns 9 THE M FUNCTIONS * Inserting text functions * Insert an IF function * Create a query group 10 PIVOTING TABLES * Pivot a table * Pivot and append tables * Pivot but don't aggregate * Unpivot tables * Append mismatched headers 11 DATA MODELLING EXPANDED * Understanding relationships * Mark a date table 12 DAX NEW COLUMNS * New columns and measures * New column calculations * Insert a SWITCH function 13 INTRODUCTION TO DAX MEASURES * Common measure functions * Insert a SUM function * Insert a COUNTROWS function * Insert a DISTINCTCOUNT function * Insert a DIVIDE function * DAX rules 14 THE CALCULATE MEASURE * The syntax of CALCULATE * Insert a CALCULATE function * Control field summarisation * Things of note 15 THE SUMX MEASURE * X iterator functions * Anatomy of SUMX * Insert a SUMX function * When to use X functions 16 TIME INTELLIGENCE MEASURES * Importance of a calendar table * Insert a TOTALYTD function * Change financial year end date * Comparing historical data * Insert a DATEADD function 17 HIERARCHIES AND GROUPS * Mine data using hierarchies * Compare data in groups
Power BI - advanced (1 day) (In-House)
By The In House Training Company
This course starts with data transformation strategies, exploring capabilities in the Power Query Editor, and data-cleansing practices. It looks at the Advanced Query Editor to view the M language code. This course focuses on advanced DAX measures that include filtering conditions, with a deep dive into time intelligence measures. Like the M query language, DAX is a rich functional language that supports variables and expression references. This course also looks at the creation of dynamic dashboards and incorporates a range of visualisations available in Power BI Desktop and online in the AppSource. The course finishes with a look at setting up end user level security in tables. 1 THE QUERY EDITOR * Split by row delimiter * AddDays to determine deadlines * Advanced query editor 2 FUZZY MATCHING JOINS * Matching inconsistencies by percentage * Matching with transformation table 3 LOGICAL COLUMN FUNCTIONS * Logical functions IF, AND, OR * Using multiple conditions * Including FIND in functions 4 EDITING DAX MEASURES * Make DAX easier to read * Add comments to a measure * Using quick measures 5 THE ANATOMY OF CALCULATE * Understanding CALCULATE context filters * Adding context to CALCULATE with FILTER * Using CALCULATE with a threshold 6 THE ALL MEASURE * Anatomy of ALL * Create an ALL measure * Using ALL as a filter * Use ALL for percentage 7 DAX ITERATORS * Anatomy of iterators * A closer look at SUMX * Using RELATED in SUMX * Create a RANKX * RANKX with ALL 8 DATE AND TIME FUNCTIONS * Overview of functions * Create a DATEDIFF function 9 TIME INTELLIGENT MEASURES * Compare historical monthly data * Create a DATEADD measure * Creating cumulative totals * Creating cumulative measures * Visualising cumulative totals 10 VISUALISATIONS IN-DEPTH * Utilising report themes * Create a heatmap * Comparing proportions * View trends with sparklines * Group numbers using bins * Setting up a histogram 11 COMPARING VARIABLES * Visualising trendlines as KPI * Forecasting with trendlines * Creating a scatter plot * Creating dynamic labels * Customised visualisation tooltips * Export reports to SharePoint 12 USER LEVEL SECURITY * Setting up row level security * Testing user security
Tableau Desktop Training - Analyst
By Tableau Training Uk
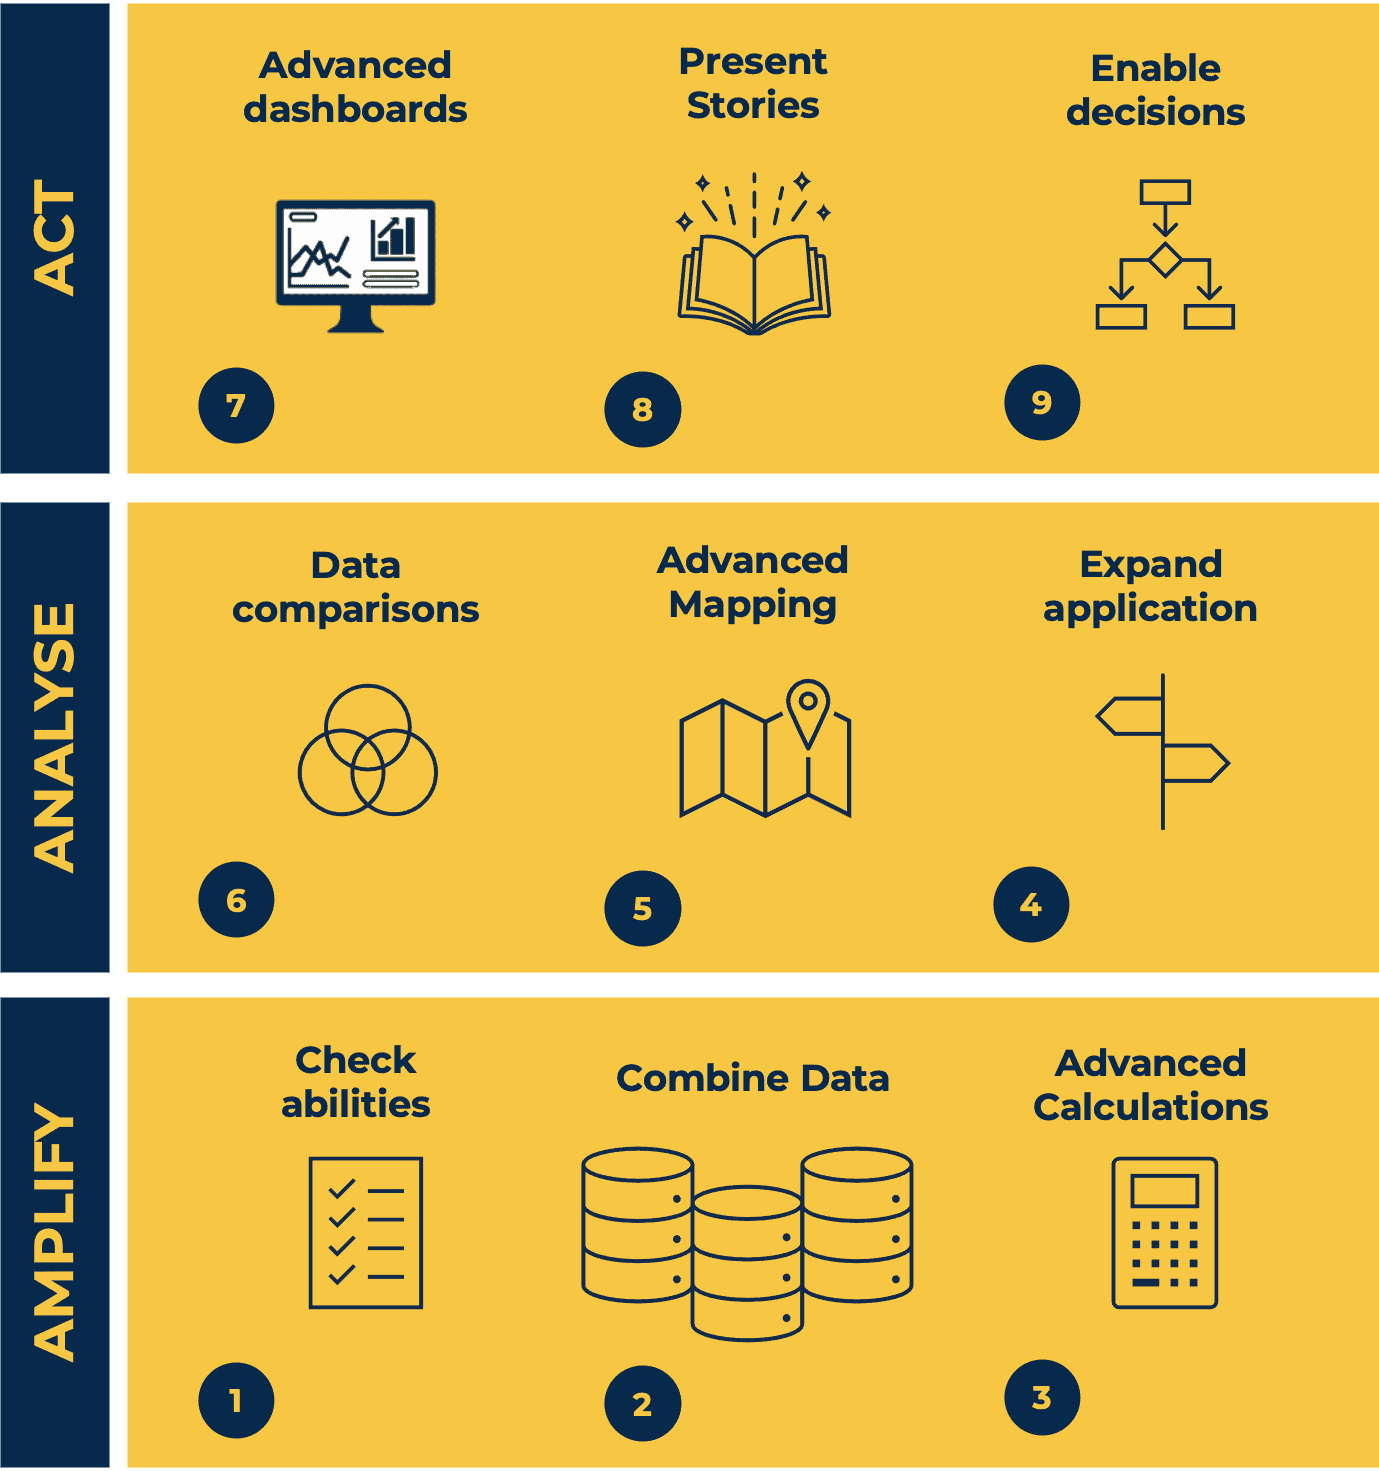
This Tableau Desktop Training intermediate course is designed for the professional who has a solid foundation with Tableau and is looking to take it to the next level. -------------------------------------------------------------------------------- For Private options, online or in-person, please send us details of your requirements: -------------------------------------------------------------------------------- This Tableau Desktop training intermediate course is designed for the professional who has a solid foundation with Tableau and is looking to take it to the next level. Attendees should have a good understanding of the fundamental concepts of building Tableau worksheets and dashboards typically achieved from having attended our Tableau Desktop Foundation Course. At the end of this course you will be able to communicate insights more effectively, enabling your organisation to make better decisions, quickly. The Tableau Desktop Analyst training course is aimed at people who are used to working with MS Excel or other Business Intelligence tools and who have preferably been using Tableau already for basic reporting. -------------------------------------------------------------------------------- THE COURSE IS SPLIT INTO 3 PHASES AND 9 MODULES: PHASE 1: AMPLIFY MODULE 1: CHECK ABILITIES * Revision – What I Should Know * * What is possible * How does Tableau deal with data * Know your way around * How do we format charts * How Tableau deals with dates * Charts that compare multiple measures * Creating Tables MODULE 2: COMBINE DATA * Relationships * Joining Tables – Join Types, Joining tables within the same database, cross database joins, join calculations * Blending – How to create a blend with common fields, Custom defined Field relationships and mismatched element names, Calculated fields in blended data sources * Unions – Manual Unions and mismatched columns, Wildcard unions * Data Extracts – Creating & Editing Data extracts MODULE 3: ADVANCED CALCULATIONS * Row Level v Aggregations * Aggregating dimensions in calculations * Changing the Level of Detail (LOD) of calculations – What, Why, How * Adding Table Calculations PHASE 2: ANALYSE MODULE 4: EXPAND APPLICATION * Making things dynamic with parameters * Sets * Trend Lines * How do we format charts * Forecasting MODULE 5: ADVANCED MAPPING * Using your own images for spatial analysis * Mapping with Spatial files MODULE 6: DATA COMPARISONS Advanced Charts * Bar in Bar charts * Bullet graphs * Creating Bins and Histograms * Creating a Box & Whisker plot PHASE 3: ACT MODULE 7: ADVANCED DASHBOARDS * Using the dashboard interface and Device layout * Dashboard Actions and Viz In tooltips * Horizontal & Vertical containers * Navigate between dashboards MODULE 8: PRESENT STORIES * Telling data driven stories MODULE 9: ENABLE DECISIONS * What is Tableau Server * Publishing & Permissions * How can your users engage with content -------------------------------------------------------------------------------- This training course includes over 25 hands-on exercises and quizzes to help participants “learn by doing” and to assist group discussions around real-life use cases. Each attendee receives a login to our extensive training portal which covers the theory, practical applications and use cases, exercises, solutions and quizzes in both written and video format. Students must bring their own laptop with an active version of Tableau Desktop 2018.2 (or later) pre-installed. -------------------------------------------------------------------------------- WHAT PEOPLE ARE SAYING ABOUT THIS COURSE “Course was fantastic, and completely relevant to the work I am doing with Tableau. I particularly liked Steve’s method of teaching and how he applied the course material to ‘real-life’ use-cases.” Richard W., Dashboard Consulting Ltd “This course was extremely useful and excellent value. It helped me formalise my learning and I have taken a lot of useful tips away which will help me in everyday work.” Lauren M., Baillie Gifford “I would definitely recommend taking this course if you have a working knowledge of Tableau. Even the little tips Steve explains will make using Tableau a lot easier. Looking forward to putting what I’ve learned into practice.” Aron F., Grove & Dean “Steve is an excellent teacher and has a vast knowledge of Tableau. I learned a huge amount over the two days that I can immediately apply at work.” John B., Mporium “Steve not only provided a comprehensive explanation of the content of the course, but also allowed time for discussing particular business issues that participants may be facing. That was really useful as part of my learning process.” Juan C., Financial Conduct Authority “Course was fantastic, and completely relevant to the work I am doing with Tableau. I particularly liked Steve’s method of teaching and how he applied the course material to ‘real-life’ use-cases.” Richard W., Dashboard Consulting Ltd “This course was extremely useful and excellent value. It helped me formalise my learning and I have taken a lot of useful tips away which will help me in everyday work.” Lauren M., Baillie Gifford “I would definitely recommend taking this course if you have a working knowledge of Tableau. Even the little tips Steve explains will make using Tableau a lot easier. Looking forward to putting what I’ve learned into practice.” Aron F., Grove & Dean “Steve is an excellent teacher and has a vast knowledge of Tableau. I learned a huge amount over the two days that I can immediately apply at work.” John B., Mporium
Fraud (In-House)
By The In House Training Company
Fraud should not happen, but it does. It can happen at the highest to lowest levels in an organisation. Recent surveys show that incidents of fraud are not decreasing. Fraud costs companies money and, perhaps even more importantly, reputational damage. The losers are not just the shareholders, suppliers, customers, etc, but society as a whole. This programme shows why frauds happen, how organisations put themselves at risk and what they can do to prevent it. This programme will help directors and others understand: * The motives for committing fraud * Directors' responsibilities for identifying and reporting fraud * What types of frauds there are * How frauds are perpetrated * How they can be prevented * How regulators deal with fraud Above all, the principal objective of this programme is to help make your organisation as secure as possible from the threat of fraud. 1 MOTIVES FOR COMMITTING FRAUD - DRIVERS OF FRAUD Session objective: to understand why people might commit fraud * Drivers of fraudulent behaviour * Ambition * Greed * Theft * Conceit? * And more! 2 ACCOUNTING MECHANISMS THAT ALLOW FRAUD Session objective: to review the elements of the accounting, internal control and management processes that allow creative accounting * Income or liability? * Asset or expense? * Coding errors and misclassification * Netting off and grossing up * Off-balance sheet items 3 STRUCTURES THAT ALLOW FRAUD Session objective: to consider company and trading structures that allow frauds to be perpetrated * Group structures * Trading structures * Tax havens * Importing and exporting 4 INTERPRETATIONS AND OTHER NON-COMPLIANCE THAT ALLOW FRAUD Session objective: to look at how creative interpretations of law and accounting practice may permit fraud * The place of accounting standards * Accounting policies * Trading methods * The place of auditing standards 5 MONEY LAUNDERING Session objective: to review what constitutes money laundering * Types of money laundering * Identifying laundering * Preventing laundering 6 PREVENTING FRAUD - PROPER MANAGEMENT STRUCTURES Session objective: to review the place of proper corporate governance * Corporate governance * Company management structure * Audit committees * The place of internal audit 7 PREVENTING FRAUD - PROPER ACCOUNTING Session objective: to review best accounting and auditing practice * Accounting standards * Internal accounting policies * Adequacy of internal controls * Internal audit 8 PREVENTING FRAUD - REGULATION Session objective: to look at how regulators aim to prevent fraud * The regulatory environment * Financial services regulation 9 CONCLUSION * Course review * Open forum * Close 10 COURSE SUMMARY - DEVELOPING YOUR OWN COST ACTION PLAN * Group and individual action plans will be prepared with a view to participants identifying their cost risks areas and the techniques which can be immediately applied to improve costing and reduce costs
Commercial instinct (In-House)
By The In House Training Company
An insightful, enjoyable and experiential programme to help you analyse data and information and make a balanced decision based upon sound commercial reasoning. It will enable you to identify options, make decisions and take actions based on a thorough analysis combined with instinct and intuition to make a positive effect on profitability. This programme will help you: * Identify ways to analyse data and sort relevant from irrelevant information * Develop analytical and numerate thinking, and consider the financial implications of a decision * Make decisions based on sound commercial reasoning - a mix of intuition and analysis * Select from a range of tools to analyse a situation and apply these effectively * Understand how costs and profits are calculated * Use tried-and-tested techniques to manage and control your budgets * Appreciate the fundamentals of financial analysis * Focus on the bottom line * Identify the basics of capital investment appraisal for your business * Evaluate results and seek opportunities for improvement to your business 1 THE COMMERCIAL ENVIRONMENT * What do shareholders and investors want? * What do managers want? * Profit v non-profit organisations * Investor expectations 2 FINANCIAL AND NON-FINANCIAL INFORMATION * Risk and reward considerations * Drivers of commercial decisions 3 RUNNING A BUSINESS * A practical exercise to bring financial statements to life * Different stakeholder interests in a business * The impact and consequences of decisions on financial statements 4 WHERE DO I MAKE A DIFFERENCE TO THE ORGANISATION? * How can I contribute to an improved business performance? * Key performance indicators - measuring the right things * A 'balanced scorecard' approach - it's not all about money! 5 A 'BALANCED SCORECARD' APPROACH * Analysing and reviewing my contribution to the business direction * What is the current focus of my commercial decisions? * Developing the business in the right way - getting the balance right! * Where should/could it be in the future? * Do my decisions support the overall vision and strategy? 6 MAKING COMMERCIAL DECISIONS * Left-brain and right-brain thinking * Convergent and divergent thinking * Analysis and instinct * Interactive case study exercise - emotional and rational decisions * Reflection - what is my style of making decisions 7 LET'S CONSIDER THE CUSTOMER! * Identifying target markets * Differentiating propositions and products * Customer service considerations * Marketing considerations and initiatives * Pricing strategies and considerations 8 STRATEGIC ANALYSIS * The external environment * The internal environment * LEPEST analysis * SWOT analysis * Forecasting * Group activity - analysing markets and the competition * How do these improve your decisions? 9 COMPARING PERFORMANCE * Analysing key financial ratios * Ways to compare performance and results * Break-even analysis 10 PROFIT AND LOSS ACCOUNTS AND BUDGETING * Managing income and expenditure * The budgeting process * How does this link to the profit and loss account? * Managing and controlling a cost centre/budget * The role of the finance department * Different ways of budgeting * Incremental budgeting * Zero-based budgeting 11 UNDERSTANDING THE BALANCE SHEET * Purpose of balance sheets * Understanding and navigating the content * What does a balance sheet tell you? * How do you affect your balance sheet? * Links to the profit and loss account * A practical team exercise that brings financial statements to life 12 BUSINESS DECISIONS EXERCISE * How does this improve your decisions? * A practical exercise to apply new knowledge and bring commercial thinking to to life * The impact and consequences of decisions on financial statements 13 WORKING CAPITAL * Why is this important? * The importance of keeping cash flowing * Business decisions that affect cash * Calculating profit 14 CAPITAL INVESTMENT APPRAISAL * Capex v Opex * Payback * Return on investment * The future value of money * The concept of hurdle rate 15 LESSONS LEARNED AND ACTION PLANNING * So what? * Recap and consolidation of learning * The decisions that I need to consider * Actions to achieve my plan