365 Courses in Coventry
Visual Analytics Best Practice
By Tableau Training Uk
This course is very much a discussion, so be prepared to present and critically analyse your own and class mates work. You will also need to bring a few examples of work you have done in the past. Learning and applying best practice visualisation principles will improve effective discussions amongst decision makers throughout your organisation. As a result more end-users of your dashboards will be able to make better decisions, more quickly. This 2 Day training course is aimed at analysts with good working knowledge of BI tools (we use Tableau to present, but attendees can use their own software such as Power BI or Qlik Sense). It is a great preparation for taking advanced certifications, such as Tableau Certified Professional. -------------------------------------------------------------------------------- Contact us to discuss the Visual Analytics Best Practice course Email us if you are interested in an on-site course, or would be interested in different dates and locations -------------------------------------------------------------------------------- This Tableau Desktop training intermediate course is designed for the professional who has a solid foundation with Tableau and is looking to take it to the next level. Attendees should have a good understanding of the fundamental concepts of building Tableau worksheets and dashboards typically achieved from having attended our Tableau Desktop Foundation Course. At the end of this course you will be able to communicate insights more effectively, enabling your organisation to make better decisions, quickly. The Tableau Desktop Analyst training course is aimed at people who are used to working with MS Excel or other Business Intelligence tools and who have preferably been using Tableau already for basic reporting. -------------------------------------------------------------------------------- THE COURSE INCLUDES THE FOLLOWING TOPICS: WHAT IS VISUAL ANALYSIS? * Visual Analytics * Visual Analytics Process * Advantages of Visual Analysis * Exercise: Interpreting Visualisations HOW DO WE PROCESS VISUAL INFORMATION? * Memory and Processing Types * Exercise: Identifying Types of Processing * Cognitive Load * Exercise: Analysing Cognitive Load * Focus and Guide the Viewer * Remove Visual Distractions * Organise Information into Chunks * Design for Proximity * Exercise: Reducing Cognitive Load SENSORY MEMORY * Pre-attentive Attributes * Quantitatively-Perceived Attributes * Categorically-Perceived Attributes * Exercise: Analysing Pre-attentive Attributes * Form & Attributes * Exercise: Using Form Effectively * Colour & Attributes * Exercise: Using Colour Effectively * Position & Attributes * Exercise: Using Position Effectively ENSURING VISUAL INTEGRITY * Informing without Misleading * Gestalt Principles * Visual Area * Axis & Scale * Colour * Detail * Exercise: Informing without Misleading CHOOSING THE RIGHT VISUALISATION * Comparing and Ranking Categories * Comparing Measures * Comparing Parts to Whole * Viewing Data Over Time * Charts Types for Mapping * Viewing Correlation * Viewing Distributions * Viewing Specific Values DASHBOARDS AND STORIES * Exercise: Picking the Chart Type * Exercise: Brainstorming Visual Best Practice * Development Process for Dashboards and Stories * Plan the Visualisation * Create the Visualisation * Test the Visualisation * Exercise: Designing Dashboards and Stories -------------------------------------------------------------------------------- This training course includes over 20 hands-on exercises to help participants “learn by doing” and to assist group discussions around real-life use cases. Each attendee receives an extensive training manual which covers the theory, practical applications and use cases, exercises and solutions together with a USB with all the materials required for the training. The course starts at 09:30 on the first day and ends at 17:00. On the second day the course starts at 09:00 and ends at 17:00. Students must bring their own laptop with an active version of Tableau Desktop 10.5 (or later) pre-installed. -------------------------------------------------------------------------------- WHAT PEOPLE ARE SAYING ABOUT THIS COURSE "Steve was willing to address questions arising from his content in a full and understandable way" Lisa L. "Really enjoyed the course and feel the subject and the way it was taught was very close to my needs" James G. "The course tutor Steve was incredibly helpful and taught the information very well while making the two days very enjoyable." Bradd P. "The host and his courses will give you the tools and confidence that you need to be comfortable with Tableau." Jack S. "Steve was fantastic with his knowledge and knowhow about the product. Where possible he made sure you could put demonstrations in to working practice, to give the audience a clear understanding." Tim H. "This was a very interesting and helpful course, which will definitely help me produce smarter, cleaner visualisations that will deliver more data-driven insights within our business." Richard A. "Steve is very open to questions and will go out of his way to answer any query. Thank you" Wasif N. "Steve was willing to address questions arising from his content in a full and understandable way" Lisa L. "Really enjoyed the course and feel the subject and the way it was taught was very close to my needs" James G.

Advanced Professional Practice
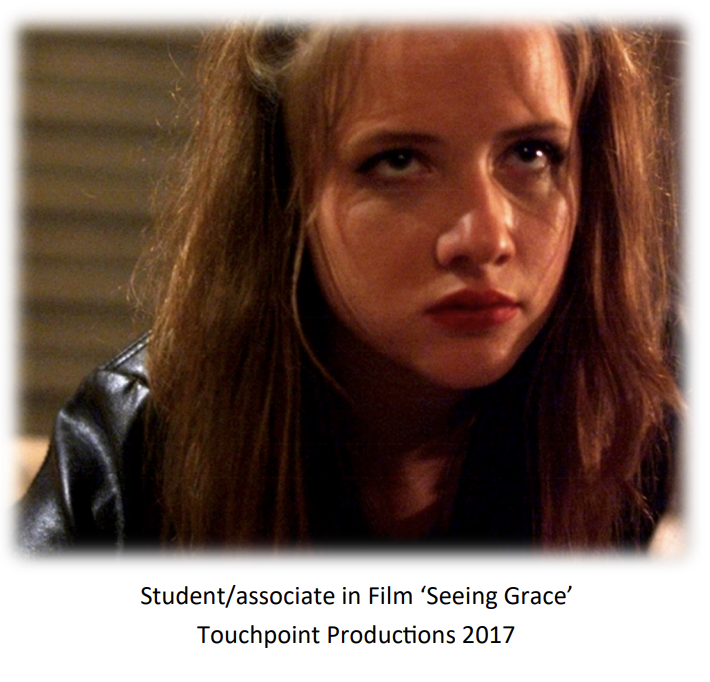
By CORE theatre arts training
CORE is a professional level training company in physical theatre and acting with a solid emphasis on the classical “Theatre Apprenticeship” training model. With 30+ years experience and using proven training methods, combined with our unique mentoring approach, we develop the whole person, in order to equip our trainees to identify their God-given calling and use their gifts to impact culture and society for good. EQUIPPING YOU FOR LIFE One of our unique qualities lies in our ability to identify your strengths, regardless of your experience and training, and develop you further. You will be challenged, receive practical skills and confidence to make your next step, whether you want to take qualifications with Trinity College London, train as a teacher or get an agent as you step into the challenging world of the performing arts. Training groups are kept small to ensure individual attention and you receive a wealth of transferrable skills to equip you for life in the workplace. OUR UNIQUE APPROACH CORE's uniqueness lies in our attention to individual coaching, personal and professional development whilst maintaining a culture of excellence and rigorous discipline. We engage trainees in professional productions for on and off stage experience, and in collaborative works with other artists and musicians. Admission is by audition only (min age 16) no educational qualifications required, as admission is based on Potential, Passion and Perseverance that are essentials required to thrive in this industry and in life!

Intermediate Professional Practice
By CORE theatre arts training
CORE is a professional level training company in physical theatre and acting with a solid emphasis on the classical “Theatre Apprenticeship” training model. With 30+ years experience and using proven training methods, combined with our unique mentoring approach, we develop the whole person, in order to equip our trainees to identify their God-given calling and use their gifts to impact culture and society for good. EQUIPPING YOU FOR LIFE One of our unique qualities lies in our ability to identify your strengths, regardless of your experience and training, and develop you further. You will be challenged, receive practical skills and confidence to make your next step, whether you want to take qualifications with Trinity College London, train as a teacher or get an agent as you step into the challenging world of the performing arts. Training groups are kept small to ensure individual attention and you receive a wealth of transferrable skills to equip you for life in the workplace. OUR UNIQUE APPROACH CORE's uniqueness lies in our attention to individual coaching, personal and professional development whilst maintaining a culture of excellence and rigorous discipline. We engage trainees in professional productions for on and off stage experience, and in collaborative works with other artists and musicians. Admission is by audition only (min age 16) no educational qualifications required, as admission is based on Potential, Passion and Perseverance that are essentials required to thrive in this industry and in life!

Foundations in Professional Practice
By CORE theatre arts training
CORE is a professional level training company in physical theatre and acting with a solid emphasis on the classical “Theatre Apprenticeship” training model. With 30+ years experience and using proven training methods, combined with our unique mentoring approach, we develop the whole person, in order to equip our trainees to identify their God-given calling and use their gifts to impact culture and society for good. EQUIPPING YOU FOR LIFE One of our unique qualities lies in our ability to identify your strengths, regardless of your experience and training, and develop you further. You will be challenged, receive practical skills and confidence to make your next step, whether you want to take qualifications with Trinity College London, train as a teacher or get an agent as you step into the challenging world of the performing arts. Training groups are kept small to ensure individual attention and you receive a wealth of transferrable skills to equip you for life in the workplace. OUR UNIQUE APPROACH CORE's uniqueness lies in our attention to individual coaching, personal and professional development whilst maintaining a culture of excellence and rigorous discipline. We engage trainees in professional productions for on and off stage experience, and in collaborative works with other artists and musicians. Admission is by audition only (min age 16) no educational qualifications required, as admission is based on Potential, Passion and Perseverance that are essentials required to thrive in this industry and in life!